Data Source
The process improvement interventions were considered exempt from institutional review board (IRB) approval; however, we obtained expedited IRB approval with waiver of consent for the research aspect of the project. We obtained clinical administrative data from the Military Health System Data Repository (MDR). We identified all adult patients aged ≥ 18 years who had a troponin test, CK-MB, or both drawn at NMCP on the following services: the EMD, IM, and cardiology. A troponin or CK-MB test was defined using Current Procedural Terminology (CPT) codes and unique Logical Observation Identifiers Names and Codes (LOINC).
Measures
The study was divided into 3 periods: the preintervention period from August 1, 2013 to July 31, 2014; the intervention period from August 1, 2014 to January 31, 2015; and the postintervention period February 1, 2015 to January 31, 2016.
The primary outcomes measured were the frequency of guideline concordance and total costs for tests ordered per month using the Centers for Medicare and Medicaid Services (CMS) clinical laboratory fee schedule of $13.40 for troponin and $16.17 for CK-MB.5Concordance was defined as ≤ 3 troponin tests and no CK-MB tests ordered during 1 encounter for a patient without an ACS diagnosis in the preceding 7 days. Due to faster cellular release kinetics of CK-MB compared with that of troponin, this test has utility in evaluating new or worsening chest pain in the setting of a recent myocardial infarction (MI). Therefore, we excluded any patient who had a MI within the preceding 7 days of an order for either CK-MB or troponin tests. Additionally, the number of tests, both CK-MB and troponin, ordered per patient encounter (hereafter referred to as an episode) were measured. Finally, we measured the monthly prevalence of ACS diagnosis and percentage of visits having that diagnosis.
Data Analysis
Descriptive statistics were used to calculate population demographics of age group, sex, beneficiary category, sponsor service, and clinical setting. Monthly data were grouped into the preintervention and postintervention periods. The analysis was performed using t tests to compare mean values and CIs before and after the intervention. Simple linear regression with attention to correlation was used to create best fit lines with confidence bands before and after the intervention. Interrupted time series (ITS) regression was used to describe all data points throughout the study. Consistency between these various methods was verified. Mean values and CIs were reported from the t tests. Statistical significance was reported when appropriate. Equations and confidence predictions on the simple linear regressions were produced and reported. These were used to identify values at the start, midpoint, and end of the pre- and postintervention periods.
Results
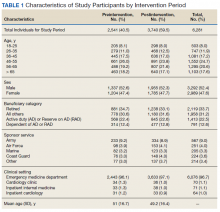
There were a total of 6,281 patients in the study population. More patients were seen during the postintervention period than in the preintervention period. The mean age of patients was slightly higher during the preintervention period (Table 1).
Guideline Concordance
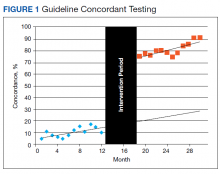
To determine whether ordering practices for cardiac enzyme testing improved, we assessed the changes in the frequency of guideline concordance during the pre- and postintervention period. On average during the preintervention year, the percentage of tests ordered that met guideline concordance was 10.1% (95% CI, 7.4%-12.9%), increasing by 0.80% (95% CI, 0.17%-1.42%) each month.
This percentage increased 59.5% from its immediate preintervention estimate of 14.5% to the immediate postintervention estimate of 74.0% (Table 2, Figure 1). On average during the postintervention year, the percentage of tests ordered that met guideline concordance was 81.2% (95% CI, 77.5%-84.8%), continuing to increase by 1.3% (95% CI, 0.7%-2.05%) each month. This rate of continuing increase was not statistically different from the preintervention period.


