From 1982 to 2011, the melanoma incidence rate doubled in the US.1 In 2018, an estimated 87,290 cases of melanoma in situ and 91,270 cases of invasive melanoma will be diagnosed in the US, and 9,320 deaths will be attributable to melanoma.2 Early detection of melanoma is critically important to reduce melanoma-related mortality, with 5-year survival rates as high as 97% at stage 1A vs a 20% 5-year survival when there is distant metastasis.2,3 Melanoma is particularly relevant for medical providers working with veterans because melanoma disproportionately affects service members with an incidence rate ratio of 1.62 (95% confidence interval [CI], 1.40-1.86) compared with that of the general population.4
Biopsy is the definitive diagnostic tool for melanoma. Histologic analysis differentiates melanoma from seborrheic keratoses, pigmented nevi, dermatofibromas, and other pigmented lesions that can resemble melanoma on clinical examination. However, biopsy must be used judiciously as unnecessary biopsies contribute to health care costs and leave scars, which can have psychosocial implications. With benign nevi outnumbering melanoma about 2 million to 1, biopsy is indicated once a threshold of suspicion is obtained.5
Dermoscopic Tool
Dermoscopy is a microscopy-based tool to improve noninvasive diagnostic discrimination of skin lesions based on color and structure analysis. Coloration provides an indication of the composition of elements present in the skin with keratin appearing yellow, blood appearing red, and collagen appearing white. Coloration also suggests pigment depth as melanin appears black when located in the stratum corneum, brown when located deeper in the epidermis, and blue when located in the dermis.6 Finally, characteristic histopathologic alterations in the dermoepidermal junction, rete ridges, pigment-containing cells, and/or melanocyte granules that occur in melanoma are recognizable with dermoscopy.6
In 2001, Bafounta and colleagues performed the first meta-analysis on the efficacy of dermoscopy compared with that of clinical evaluation, finding that dermoscopy performed specifically by dermatology-trained clinicians improved the accuracy of identifying melanoma from an odds ratio of 16 (95% CI, 9-31) with naked eye examination to 76 (95% CI, 25-223) with dermoscopy.7
More recently, Terushkin and colleagues demonstrated that diagnosis specificity improves when a general dermatologist is trained in dermoscopic pattern recognition. Naked eye examination produced a benign to malignant ratio (BMR) of 18.4:1, indicating that about 18 of 19 biopsies considered suspicious for melanoma ultimately yielded benign melanocytic lesions. Although the BMR for the general dermatologist experienced an increase after dermoscopy training, the ratio eventually decreased to 7.9:1.8
Dermoscopic Analysis
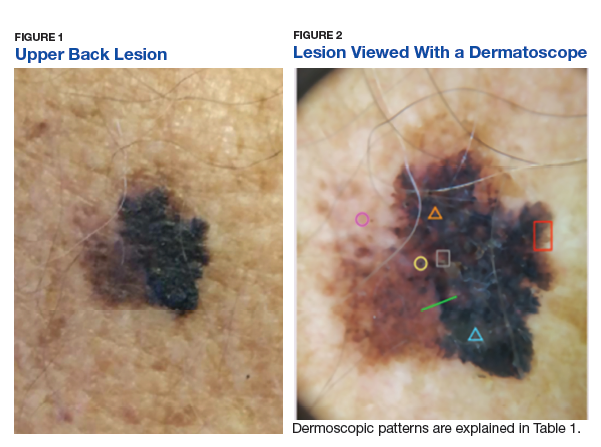
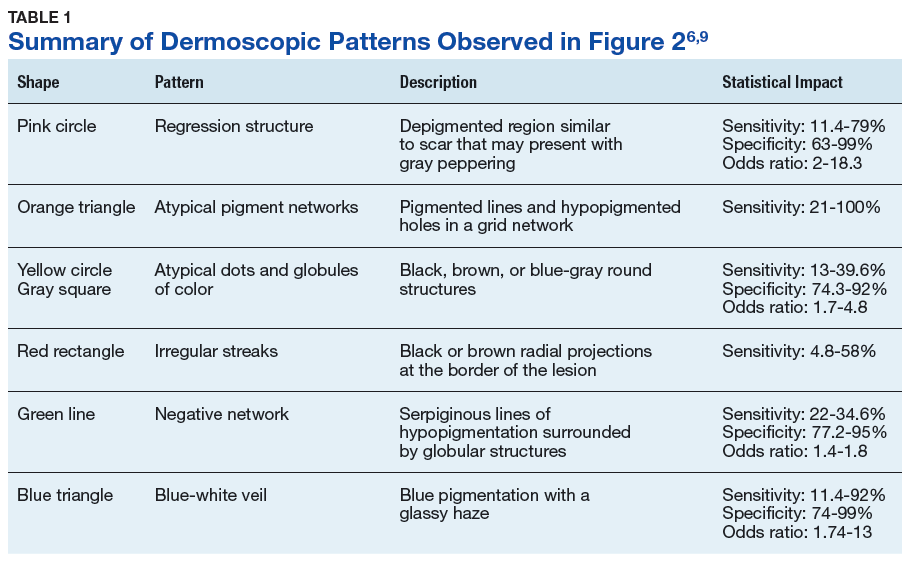
Some of the common patterns recognized in melanoma are demonstrated in Figures 1 and 2. Figure 1 is a close-up of a patient’s upper back showing a solitary asymmetric melanocytic lesion containing multiple red, brown, black, and blue hues.
Pattern analysis, the dermoscopic interpretation method preferred by pigmented lesion specialists, requires simultaneously assessing numerous lesion patterns that vary depending on body site.10 Alternative dermoscopic algorithms that focus on the most common features of melanoma have been developed to aid practitioners with the interpretation of dermoscopy findings: the 7-point checklist, the Menzies method, the ABCD rule, and the CASH algorithm (Tables 2, 3, 4, and 5).
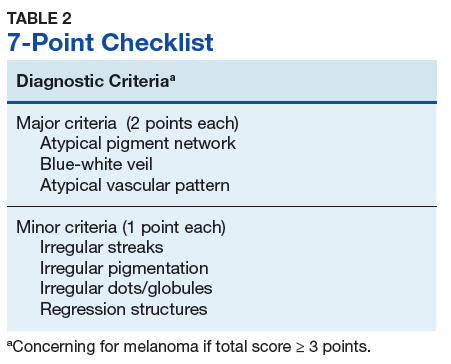
Argenziano and colleagues developed the 7-point checklist in 1998. Two points are assigned to the lesion for each of the major criteria and 1 point for each minor criteria.
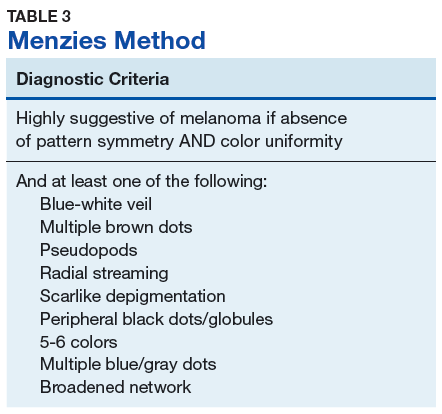
The Menzies method was developed by Menzies and colleagues in 1996. To be classified as melanoma, the pigmented lesion must show an absence of pattern symmetry and color uniformity while simultaneously exhibiting at least one of the following: blue-white veil, multiple brown dots, pseudopods, radial streaming, scarlike depigmentation, peripheral block dots/globules, 5 to 6 colors, multiple blue/gray dots, and a broadened network.12
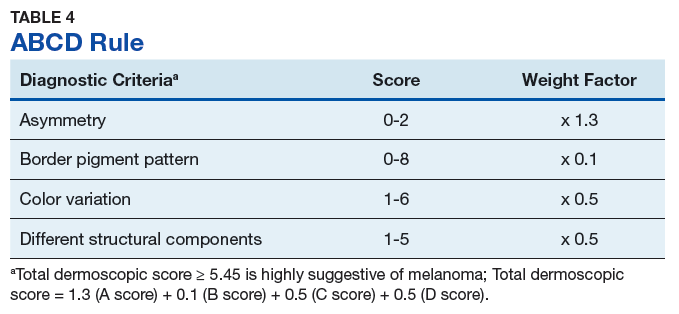
The ABCD rule is a more technical dermoscopic evaluation algorithm developed in 1994 by Stolz and colleagues. This method yields a numeric value called the total dermoscopic score (TDS) based on Asymmetry, Border pigment pattern, Color variation, and 5 Different structural components.
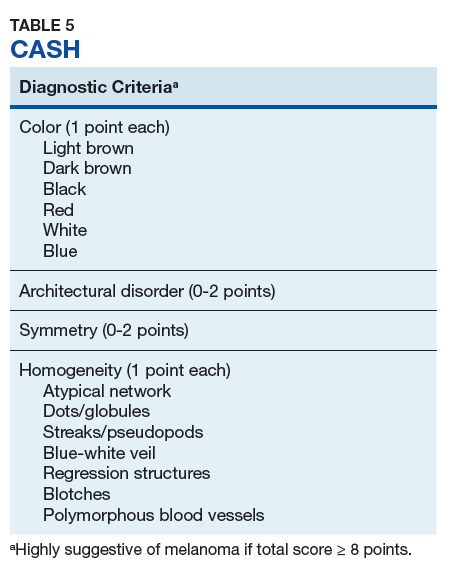
Henning and colleagues developed the CASH algorithm in 2006 with the intention of assisting less experienced dermoscopy users with lesion evaluation.14 This algorithm tallies points for Color, Architectural disorder, Symmetry, and Homogeneity. One point is attributed to a lesion for each light brown, dark brown, black, red, white, and/or blue region present. Architectural disorder is assigned a point value between 0 and 2, with 0 indicating the absence of or minimal architectural disorder, 1 indicating moderate disorder, and 2 indicating marked disorder. Symmetry is assigned a point value between 0 and 2, with 0 points assigned to a lesion that exhibits biaxial symmetry, 1 point assigned to a lesion that exhibits monoaxial symmetry, and 2 points assigned to a lesion that exhibits biaxial asymmetry. Finally, 1 point is attributed to a lesion for evidence of each of the following: atypical network, dots/globules, streaks/pseudopods, blue-white veil, regression structures, blotches > 10% of the overall lesion size, and polymorphous blood vessels. The lesion in Figure 2 scores 16 points out of the maximum total CASH score of 17. Any lesion scoring 8 or more is suggestive of malignant melanoma.14
Finally, the TADA method was developed by Rogers and colleagues in 2016.15 This method uses sequential questions to evaluate lesions. First, “Does the lesion exhibit clear dermoscopic evidence of an angioma, dermatofibroma, or seborrheic keratosis?” If “yes,” then no additional dermoscopic evaluation is necessary, and it is recommended to monitor the lesion. If the answer to the first question is “no,” then ask, “Does the lesion exhibit architectural disorder?” The presence of architectural disorder is based on an overall impression of the lesion, which includes symmetry with regard to structures and colors. Any lesion deemed to exhibit architectural disorder should be biopsied. If the lesion has no architectural disorder, the third question is, “Does the lesion contain any starburst patterns, blue-black or gray coloration, shiny white structures, negative networks, ulcers or erosions, and/or vessels?” If “yes,” then the lesion should be biopsied. Since the lesion in Figure 2 exhibits marked architectural disorder in terms of symmetry and color, analysis of the lesion with the TADA method would yield a recommendation for biopsy.15


