Results
Records review identified 17,294 adult patient hospitalizations determined by Crimson to have a medical (non-surgical, non-obstetrical) APR-DRG code as the final principal diagnosis. We excluded 15 expanded PA and 11 conventional hospitalizations that fell under APR-DRG code 956 “ungroupable.” Exclusion for referral bias resulted in the removal of 304 hospitalizations, 207 (3.03%) from the expanded PA group and 97 (0.92%) from the conventional group. These excluded hospitalizations came from 2 APR-DRG codes, urinary stones (code 465) and “other kidney and urinary tract diagnoses” (code 468). This left 6612 hospitalizations in the expanded PA group and 10,352 in the conventional group.
Charge capture data for both groups was used to determine the proportion of encounters rendered by each provider type or combination. In the expanded PA group, 35.73% of visits (10,241 of 28,663) were conducted by a PA, and 64.27% were conducted by a physician or by a PA with a billable physician “co-visit.” In the conventional group, 5.89% of visits (2938 of 49,883) were conducted by a PA, and 94.11% were conducted by a physician only or by a PA with a billable physician “co-visit”.
Readmissions
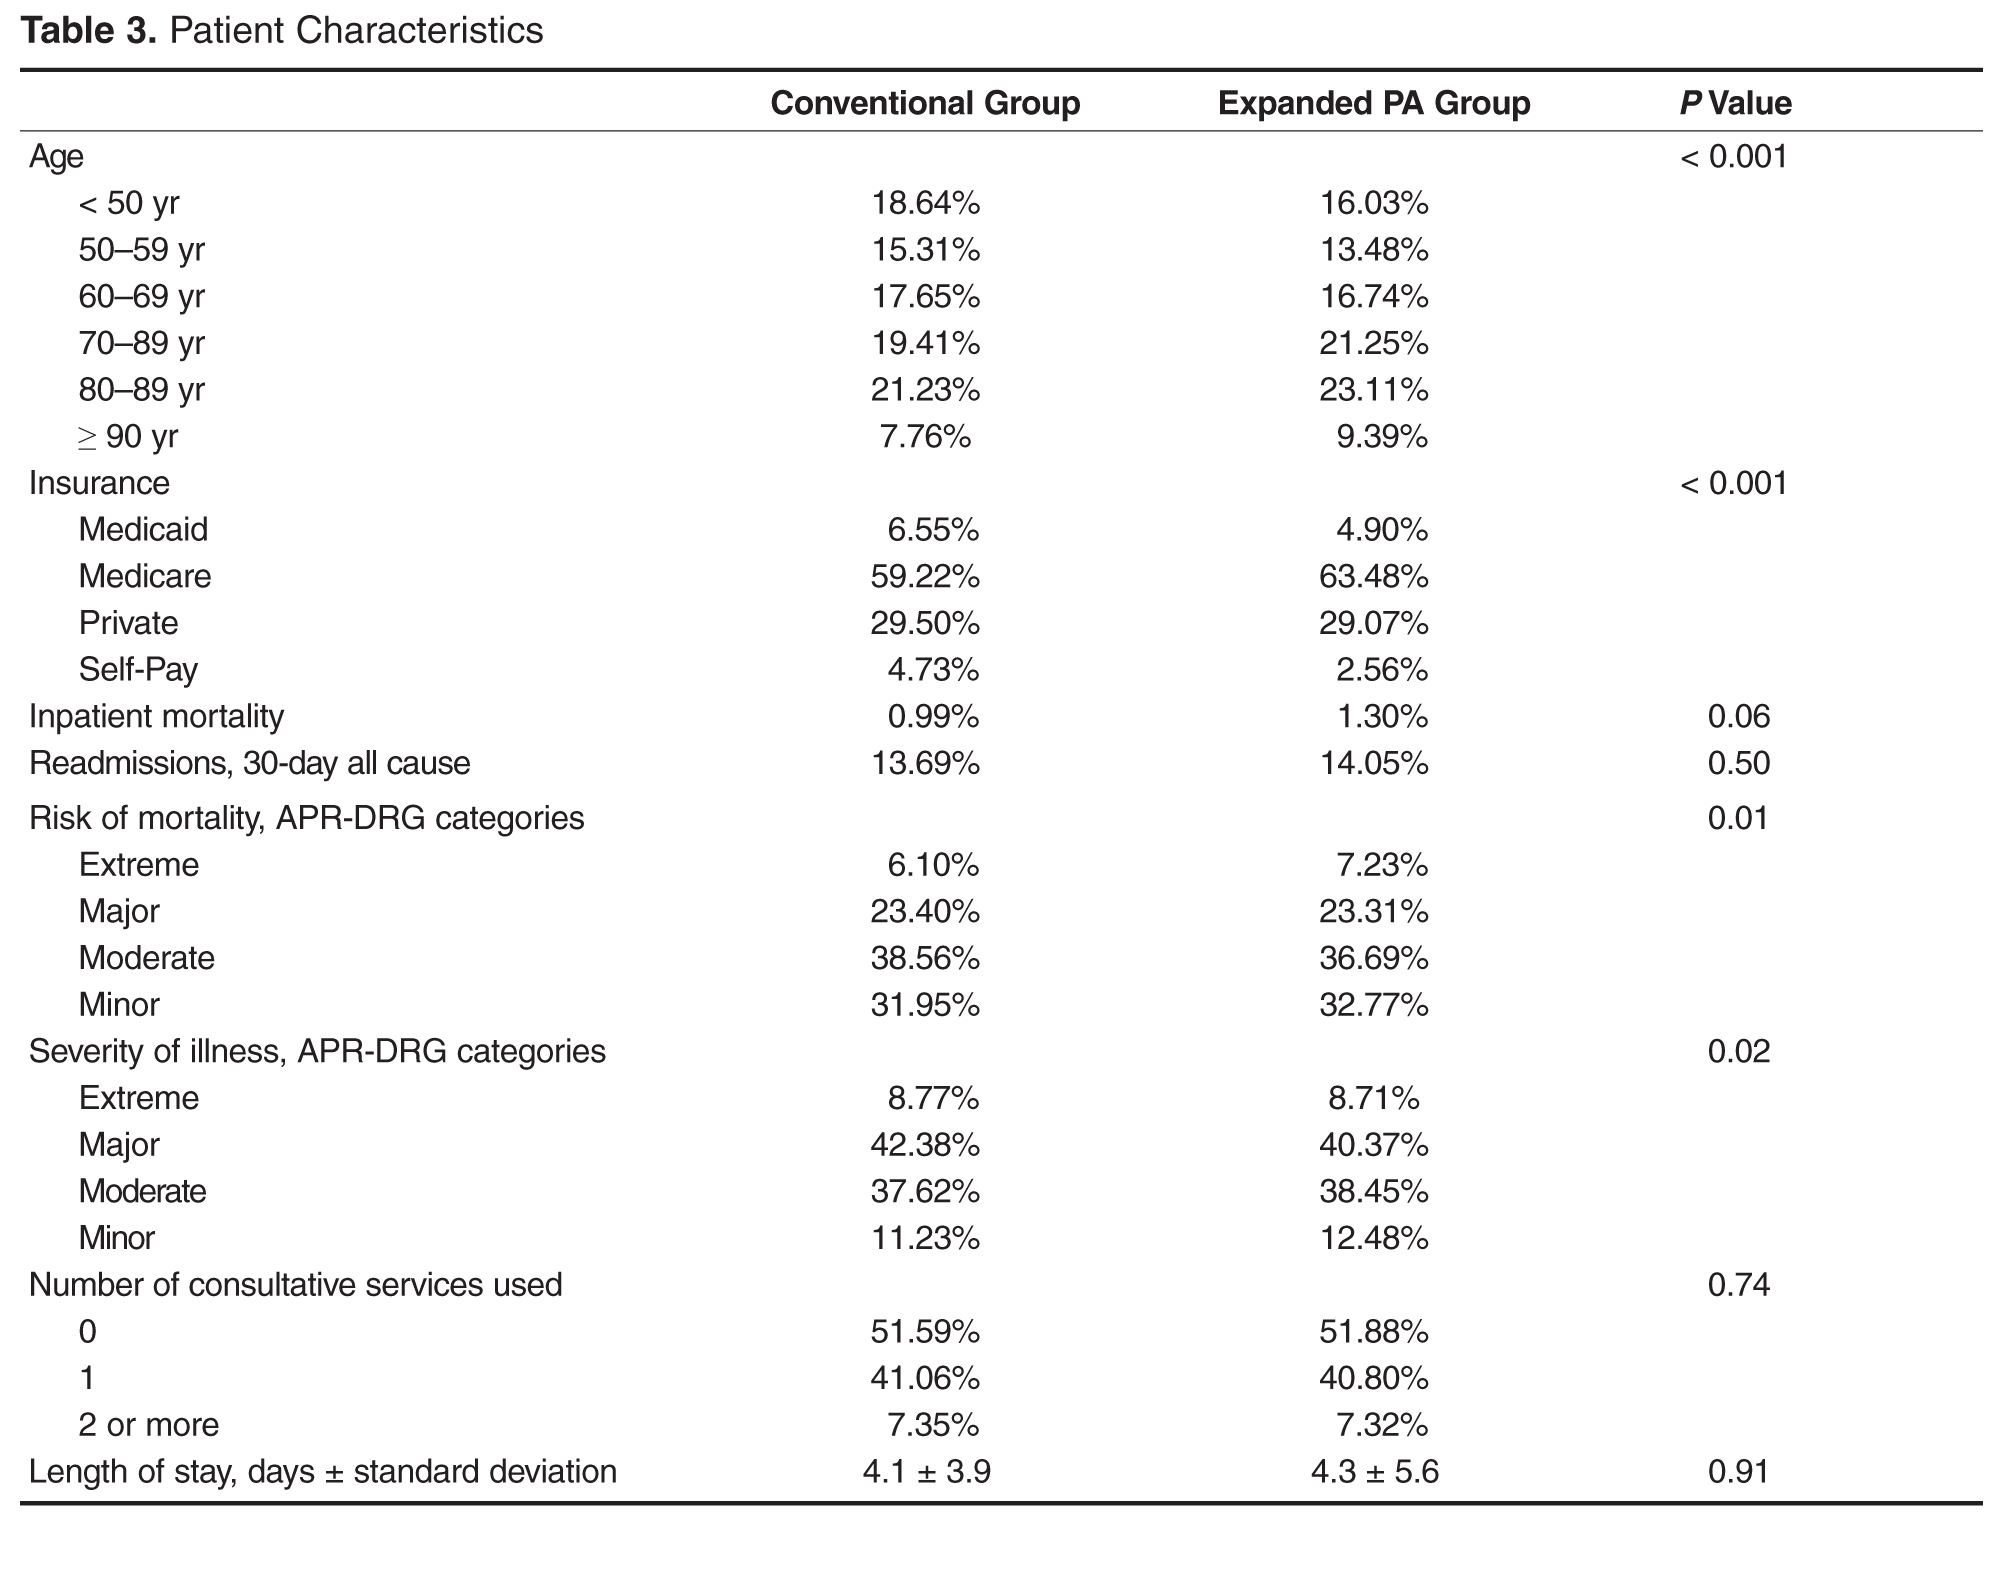
Overall, 929 of 6612 (14.05%) and 1417 of 10,352 (13.69%) patients were readmitted after being discharged by the expanded PA and conventional groups, respectively. After multivariate analysis, there was no statistically significant difference in odds of readmission between the groups (OR for conventional group, 0.95 [95% CI, 0.87–1.04]; P = 0.27).
Inpatient Mortality
Unadjusted inpatient mortality for the expanded PA group was 1.30% and 0.99% for the conventional group. After multivariate analysis, there was no statistically significant difference in odds of in-hospital mortality between the groups (OR for conventional group, 0.89 [95% CI, 0.66–1.19]; P = 0.42).
Patient Charges
The unadjusted mean patient charge in the expanded PA group was $7822 ± $7755 and in the conventional group mean patient charge was $8307 ± 10,034. Multivariate analysis found significantly lower adjusted patient charges in the expanded PA group relative to the conventional group (3.52% lower in the expanded PA group [95% CI, 2.66%–4.39%, P < 0.001). When comparing a “standard” patient who was between 80–89 and had Medicare insurance and an SOI of “major,” the cost of care was $2644 in the expanded PA group vs $2724 in the conventional group.