The QI team also completed a failure mode and effects analysis (FMEA) to identify potential failures in the clinic flow process. The FMEA helped to identify low-hanging fruit “quick fixes,” PDSAs, and develop process maps. Weekly data guided our PDSAs and allowed us to continuously improve our processes, and team members were accountable for specific weekly action items.
Measurement/Analysis
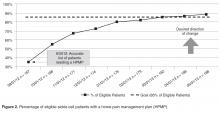
The home pain management implementation process was monitored and tracked using 2 weekly run charts: one that displayed the percentage of eligible SCD patients who needed a HPMP each week that actually received one and one that showed the overall number of eligible SCD patients with a HPMP (population metric). Run charts provide a graphic display of process performance over time and allowed the team to track and monitor process outcomes. The goal was that at least 85% of eligible patients would receive the HPMP intervention by November 2012.
Outcomes were evaluated using a monthly p-chart showing the percentage of SCD patients seen in the ED for uncomplicated SCD pain. For the current project, a p-chart was used because ED visits were categorized (see below) and the sample size varied by month. We conducted a retrospective chart review of each ED visit to extract the initial complaint and the final assessment from the ED providers’ notes. ED visits were categorized as follows: (1) fever (with or without other symptoms such as pain), (2) uncomplicated SCD pain only, and (3) other (eg, trauma, asthma). The goal was to monitor ED visits for uncomplicated SCD pain only to determine if the rate of this type of ED visit decreased after the implementation of the HPMP. Based on the chart review of the 12 months prior to the implementation of the HPMP, the majority of SCD patients seen in the ED had 0–3 ED visits for uncomplicated SCD pain. Only 7 patients had more than 3 ED visits: two had 4 ED visits, two had 5 ED visits, one had 6 visits, one had 7 visits, and one had 13 visits to the ED. Because the patient with 13 visits has complex psychosocial issues that greatly impact the use of the ED and inpatient medical services, this data was excluded from our analyses.
The Children’s Hospital Medical Center Institutional Review Board exempted this study from review because it was deemed to be a QI project with the intent to improve care locally and not to develop generalizable
knowledge.
RESULTS
As of May 2013, 100% of eligible patients who needed a home pain management plan actually received one during their clinic visit ( Figure 1 ), and this performance was maintained for 4 weeks. Almost all (98%) of these patients ( n = 183) met with the team psychology provider. Of the 5 patients who were referred to the team psychology provider but not seen, one declined the service, 2 patients were experiencing acute pain, one family was overwhelmed by the amount of medical information received at the visit and asked that the team psychology provider see them at their next visit, and one patient was asleep.

