Methods
Setting
Data were obtained from an academic family medicine clinic in the southeastern United States. Approximately 56,000 patient visits to this clinic are conducted annually. Family medicine residents in training, fellows, faculty physicians, physician assistants, a nutritionist, and diabetes educators care for patients seen in this practice.
Data Collection
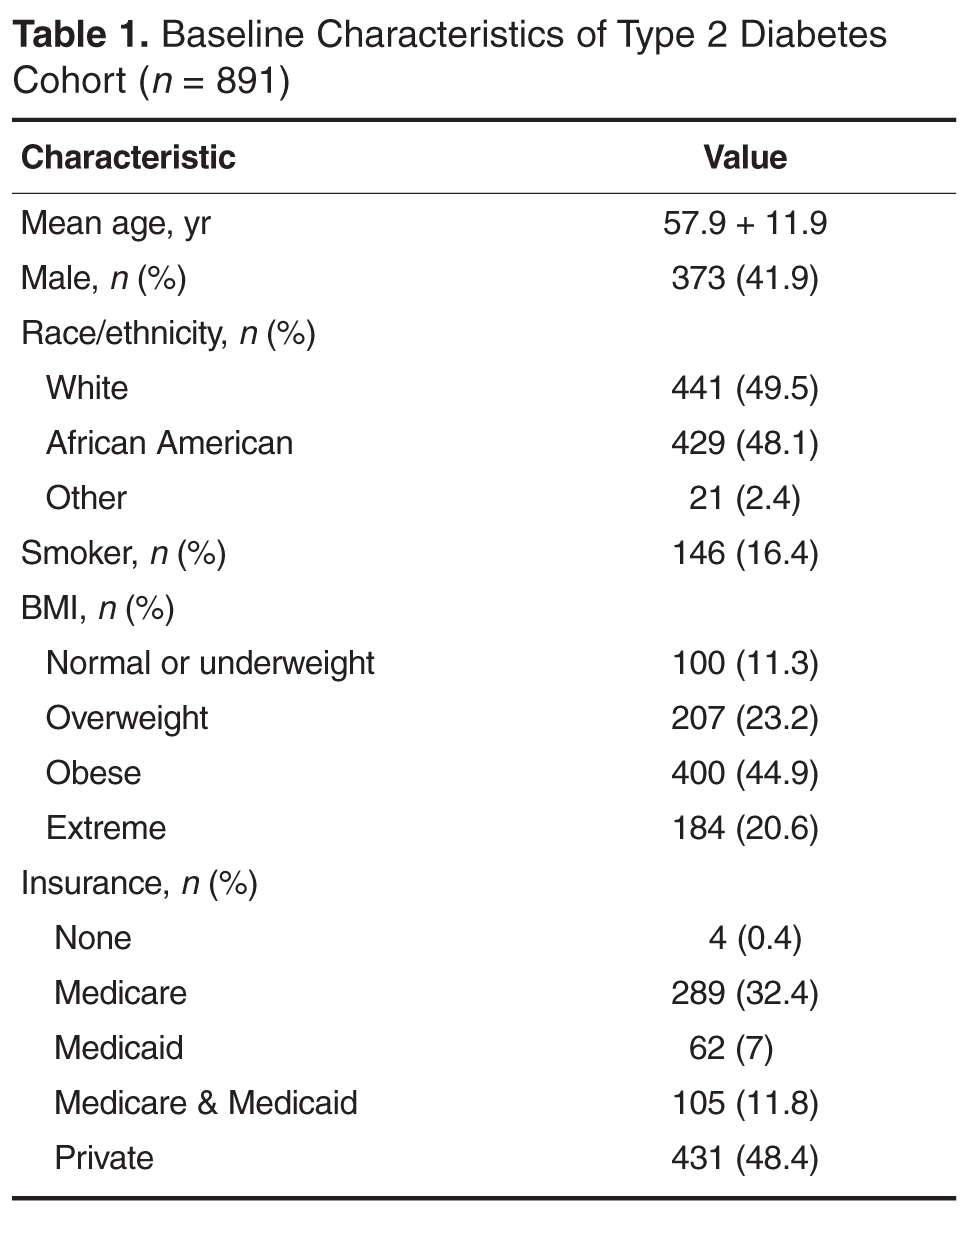
A cohort of patients was identified using the International Classification of Diseases, 9th Revision, Clinical Modification codes for type 2 diabetes. The cohort comprised patients with diabetes in 2006 and 2012 who made follow-up visits in both years.
The data from both time-points were obtained from electronic medical record (EMR) data capture and structured chart review. Two reviewers reviewed 10% of the charts for accuracy after the data was pre-populated from the EMR. The following data were obtained: demographic variables (patient age, gender, and race), height, weight, insurance, smoking status, A1C, LDL, and BP measurements, pharmacotherapy for glycemia, hypertension, and hyperlipidemia, and number of medications needed for control. For variables that had multiple measures, we calculated an average for the year.
The study protocol was approved by the Institutional Review Board at Wake Forest School of Medicine.
Statistical Analysis
Descriptive statistics were performed to compute means, standard deviations, frequencies, and percentages for demographic variables and for glycemia, BP, LDL includ-ing patient characteristics, diabetes outcomes, and pharmacotherapy medication variables. Paired t tests were used to assess for a difference at the level of the patient in the means of the A1C, BP, and LDL between the 2 study time-points (2-sided alpha = 0.05). The non-parametric McNemar test was used to assess for differences in the proportions of patients at the identified goal for A1C, LDL, and BP for 2006 and 2012.
Results
The number of visits per patient was 5.9 in 2006 and 5.3 in 2012. A1C remained constant between 2006 and 2012 (mean 7.6% vs. 7.7%, ± 1.8) along with body mass index (BMI), while mean LDL cholesterol significantly decreased from 109 ± 36.4 mg/dL in 2006 to 98.8 ± 40.4 mg/dL in 2012 ( Table 2 ). Mean systolic BP marginally increased over the 6-year period from 131.5 ± 14.2 to 134.8 ± 16.1 mm Hg with diastolic BP remaining constant.
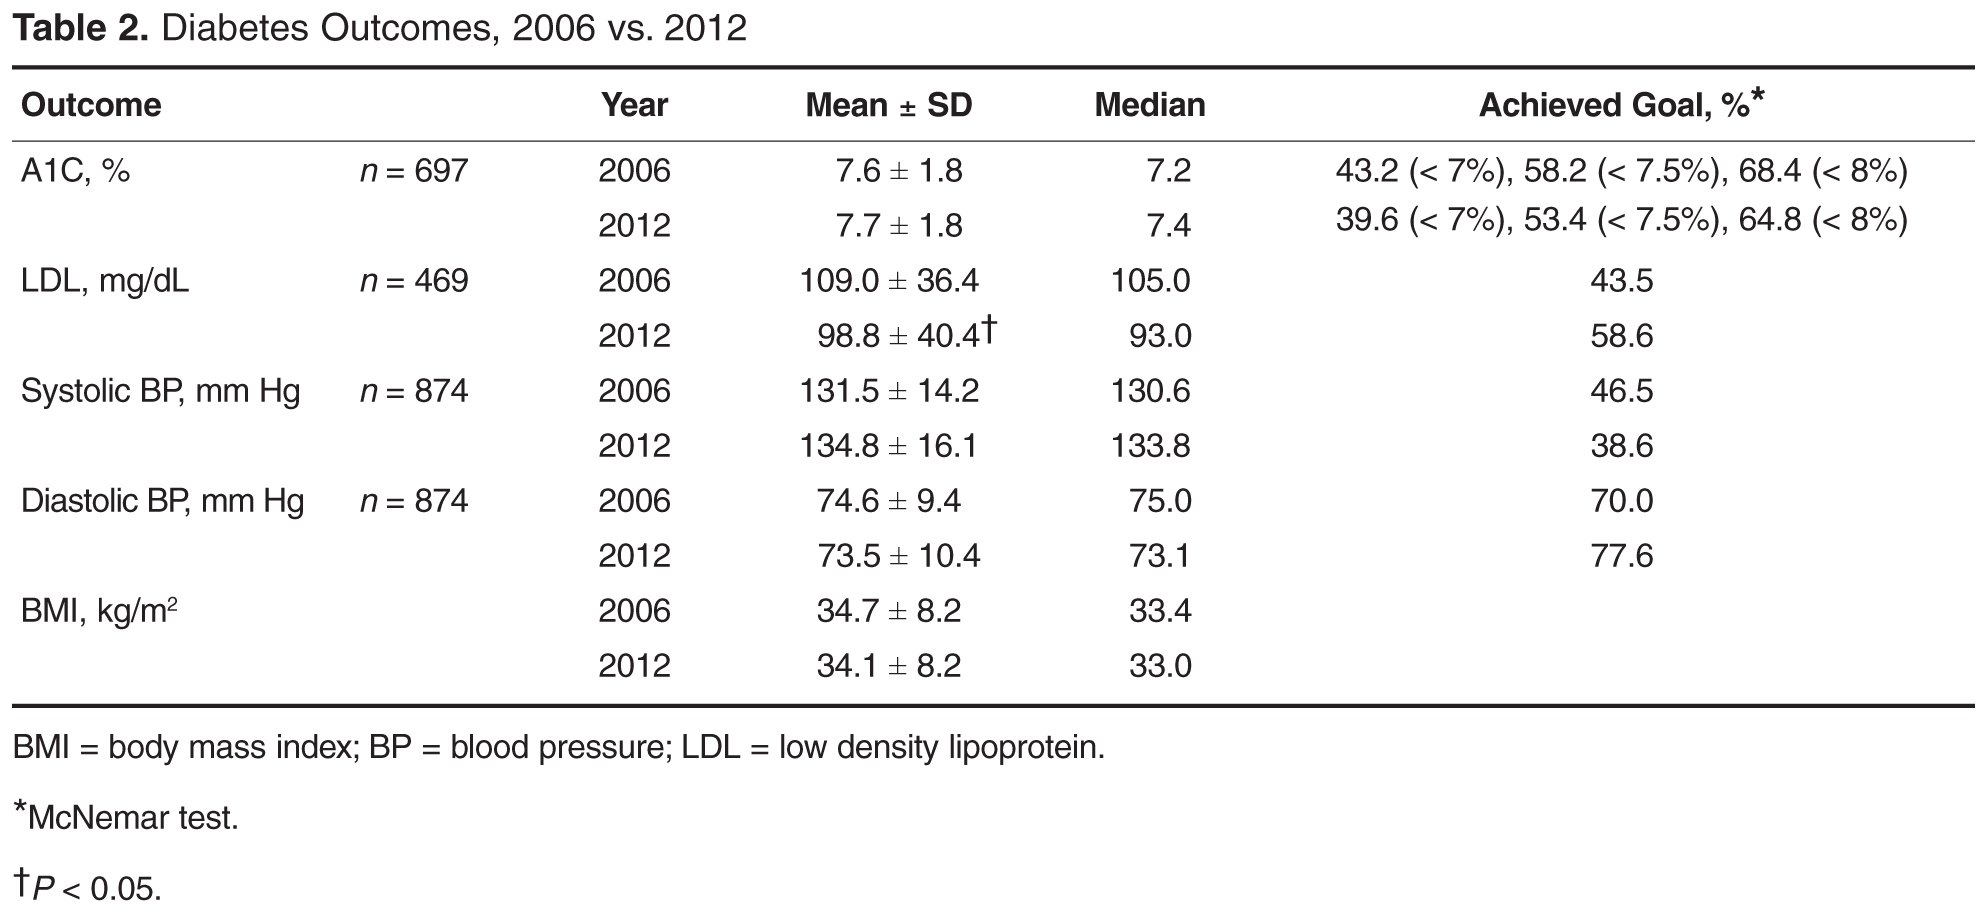
The percentage of patients achieving the less stringent A1C goal of < 8% comprised over 50% of the population at both time points; however, compared with 2006, in 2012 there was a lower percentage of patients at the more stringent A1C target of < 7% (43.2% vs. 39.6%). The percentage of patients achieving goal for systolic BP was significantly decreased to 38.6% in 2012 versus 46.5% in 2006 (Table 2). However, the proportion of patients with controlled diastolic BP rose significantly from 70% to 77.6%. The number of patients achieving goal LDL (< 100 mg/dL) increased from 43.5% in 2006 to 58.6% in 2012.