Educational Outreach
The success of a palliative care program depends on other clinicians’ acceptance and referral to the clinical program. We took a 2-pronged approach, focusing on both hospital-based and community-based education. The hospital-based nursing education included 30-minute presentations on general overviews of palliative care, differences between palliative care and hospice, and acute symptom management at the end of life. The palliative care team presented to all medical, surgical, and intensive care units and encompassed all shifts of nursing staff. These lectures included pre- and post-tests to assess for impact and feedback. Similar educational presentations, as well as an hour-long presentation on opioids and palliative care, were available for physicians for CME opportunities. We also distributed concise palliative care referral packets to outpatient primary care offices through the health system’s marketing team. The referral packets included examples of diagnoses, clinical scenarios, and symptoms to assist in the physicians’ understanding of palliative care services. The palliative care team also met with clinic office managers to discuss the program and answer questions.
There were also educational opportunities for patients and families in our community. Taking advantage of previously developed partnerships between the hospital system and local media outlets, the palliative care team performed local radio spots to educate the community on topics including an overview of palliative care, how to request palliative care, and the difference between palliative care and hospice care. We partnered with a local hospice agency and developed a well-received bereavement seminar for patients, family members, and employees and included the topic of advanced care planning.
Data Collection
We collect data using 2 different tools: a self-maintained spreadsheet shared between our palliative care clinicians, and a collective data tool (QDACT) included in our membership with and maintained by the Global Palliative Care Quality Alliance. Data collected and tracked in our spreadsheet includes date of consult, patient age, primary and secondary diagnoses, disposition, goals of care discussions, date of death, and 30-day readmissions. Through the QDACT data monitoring program, we are tracking and analyzing quality measures including symptom assessment and management and code status conversion. The QDACT database also provides financial data specific to our institution such as cost savings based on our billing, readmission rates, and length of stay.
Results
Projections, Volumes, and Penetration
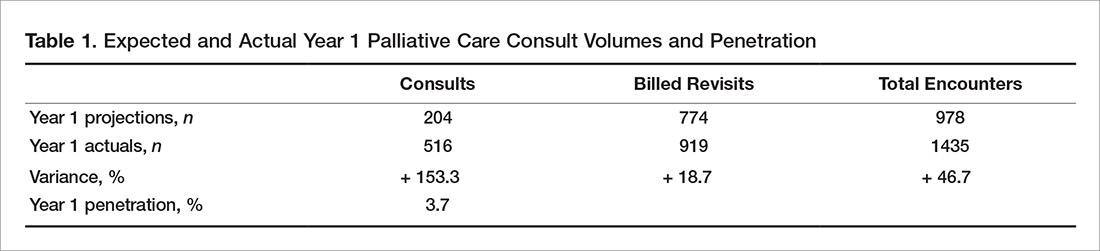
Prior to the start of our program, our chief medical office used Center to Advance Palliative Care tools to project inpatient consultation volumes at our institution. Variables that are recommended by this center to guide projections include number of hospital admissions per year, hospital occupancy, disposition to hospice, as well as generalized estimations of inpatient mortality rates. Based on our data, it was expected that our program would receive 204 new inpatient consults in our first year, and 774 follow-up visits. Our actual new inpatient consults totaled 516, with 919 follow-up visits. Palliative care penetration (percentage of annual hospital admissions seen by the palliative care team) our first year was 3.7% (Table 1).
Consultation Demographics
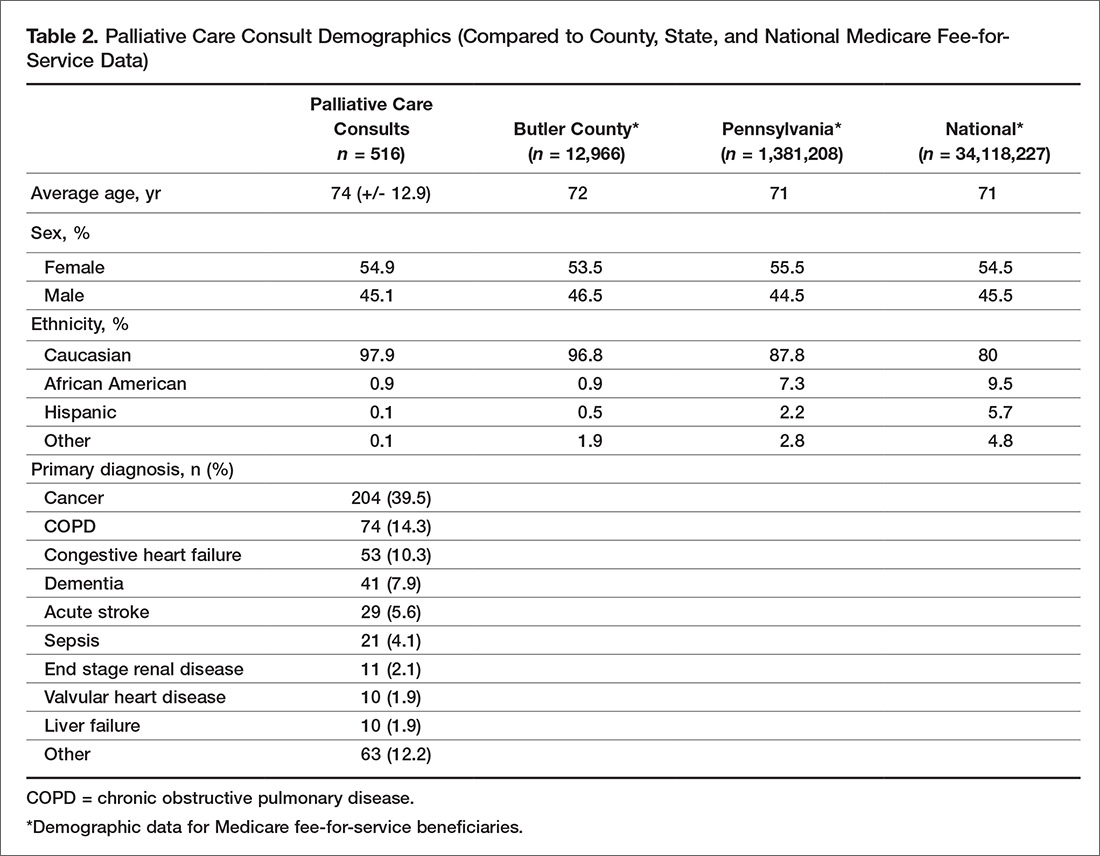
The demographics of the patients seen by the palliative care team reflect that of Butler County’s Medicare fee-for-service (FFS) population (Table 2); however, differences were seen at the state and national level with regard to ethnicity (Table 2).
Almost half of consultations (49%) were placed by the hospitalist service. Since the ICU is an open unit, critical care consults are not adequately reflected by analysis of the ordering physician alone. Analysis of consultation location revealed that 27% of inpatient consults were located within the ICU.
Patient Outcomes and Disposition
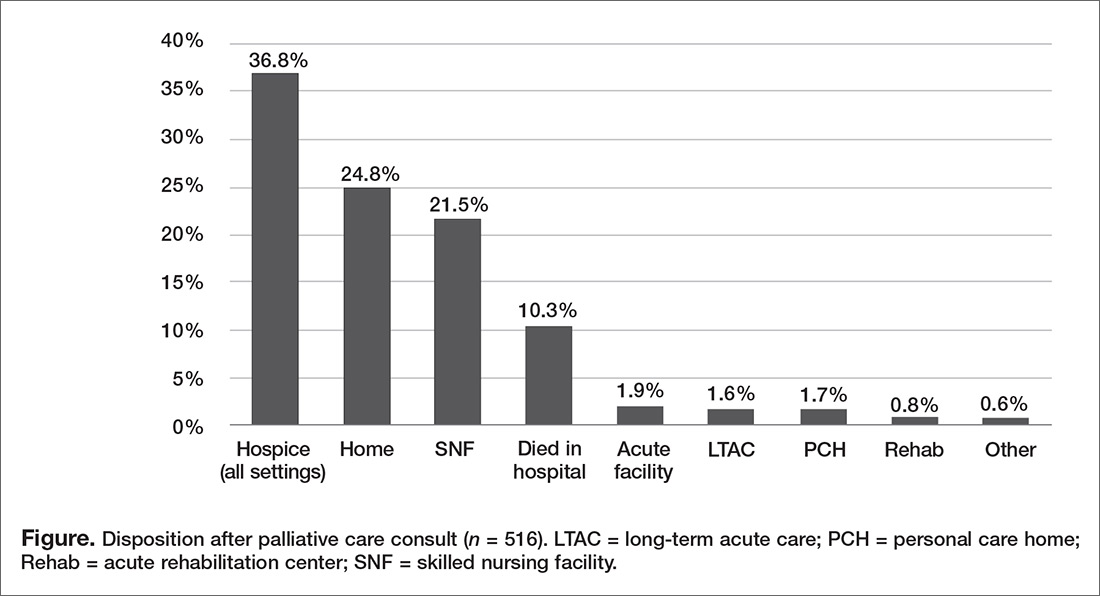
Outcomes and discharge data from the first year were collected and reviewed. Ten percent of the patients seen by palliative care died in the hospital, and 51% of patients that were seen by palliative care died within the program’s first year. Thirty-seven percent of patients discharged from the hospital utilized hospice services at home, in residential nursing facility, or at an inpatient hospice unit. The remaining 53% were discharged without hospice services to home or facility (Figure).
Hospice utilization by the health system increased during our first year. Compared to the 2014 calendar year, there were a total of 263 referrals for hospice services. During the first year of the palliative care program, which started August 2015, there were a total of 293 referrals. Of the 293 total hospice referrals, 190 (64.8%) of these referrals were for patients seen by the palliative care team.