Results
Respondent Characteristics
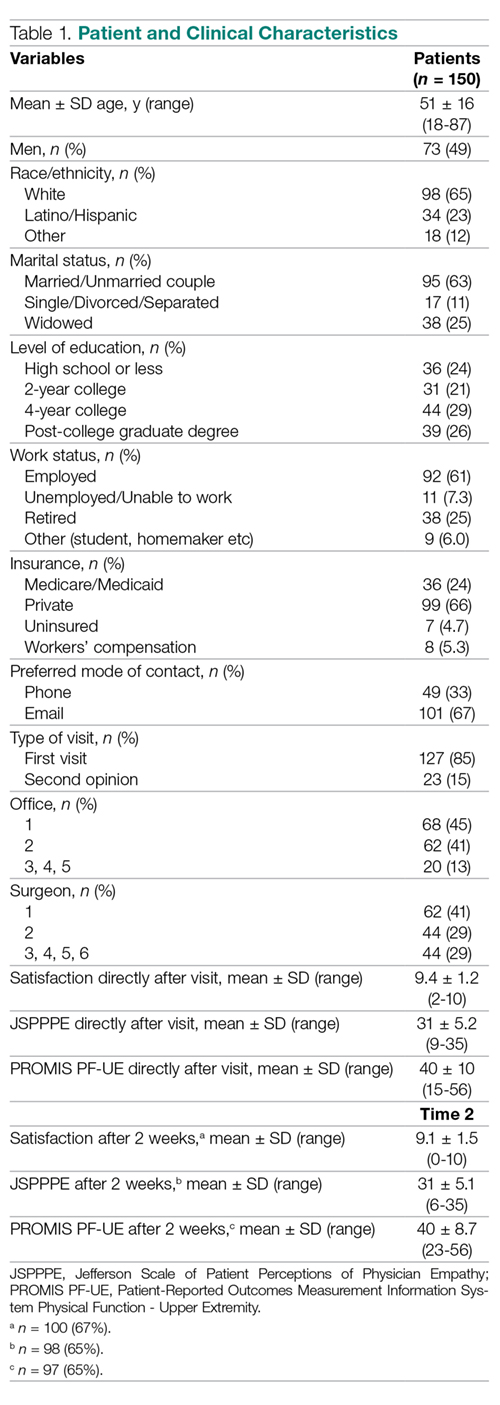
None of the 150 patients were excluded from the analysis. The study patients’ mean age was 51 ± 16 years (range, 18-87 years), and 73 (49%) were men (Table 1). Mean scores directly after the visit were 9.4 ± 1.2 (range, 2-10) for satisfaction with the surgeon, 31 ± 5.2 (range, 9-35) for perceived physician empathy, and 40 ± 10 (range 15-56) for upper extremity disability. Most patients (n = 130, 87%) were seen in 2 of 5 offices, and 106 (71%) were seen by 2 out of 6 participating surgeons.
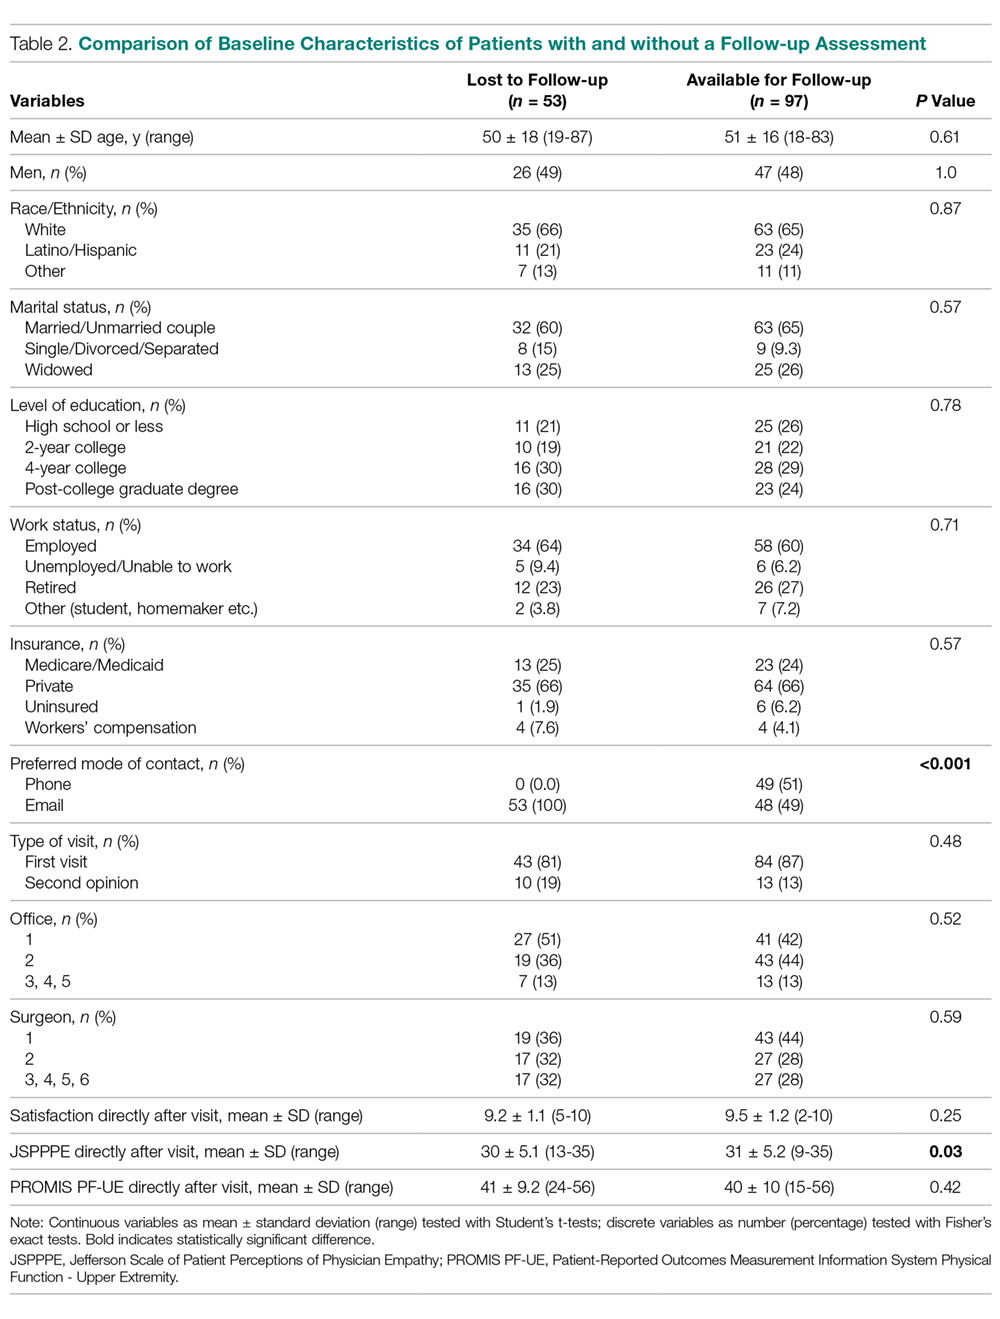
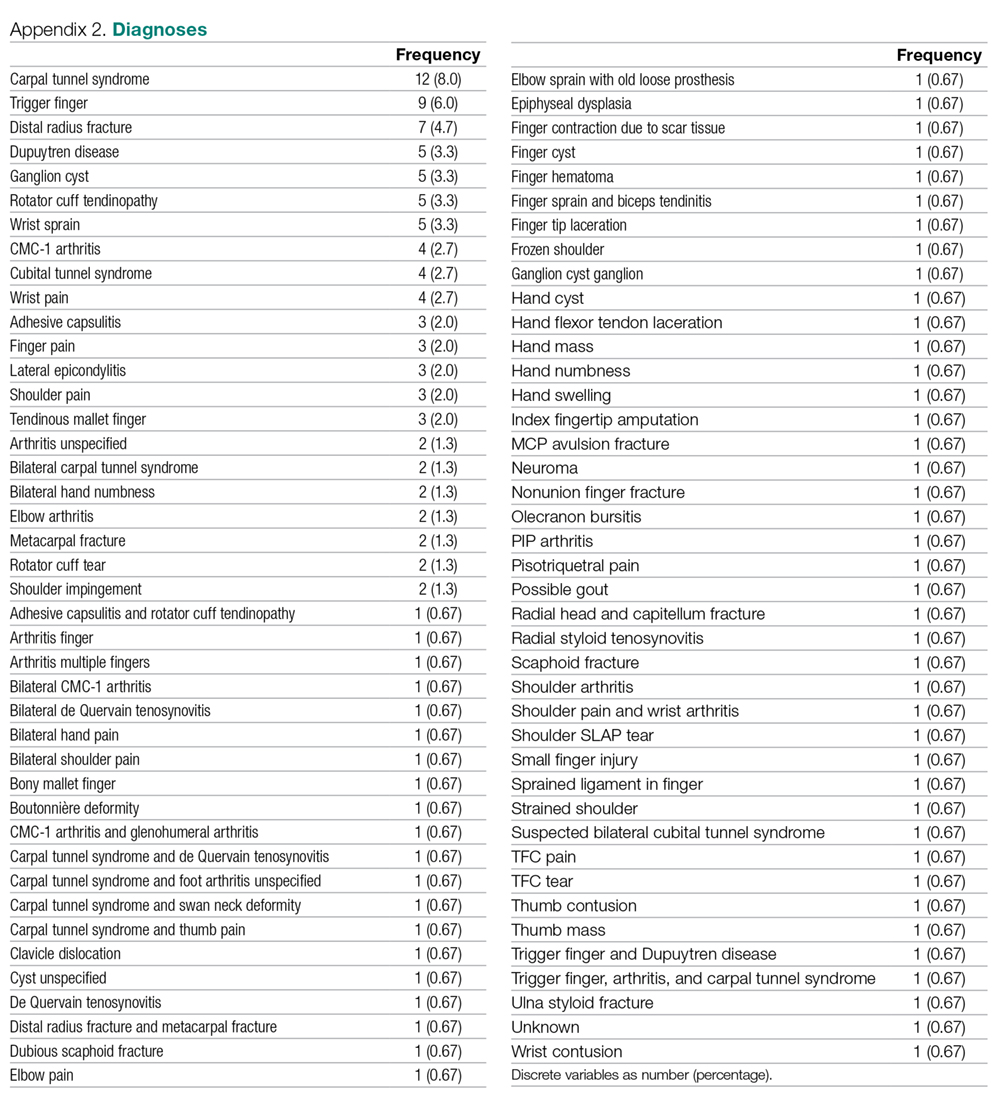
Ninety-seven (65%) patients completed their follow-up assessment 2 weeks after their initial visit, 49 (51%) by phone and 48 (49%) by email. This is a slightly better rate than the 36% rate reported in previous research.18 After 2 weeks, the mean score for satisfaction with the surgeon was 9.1 ± 1.5 (range, 0-10), the mean perceived empathy score was 31 ± 5.1 (range, 6-35), and the mean upper extremity disability score was 40 ± 8.7 (range, 23-56). Responders did not differ from nonresponders based on demographic data (Table 2). However, nonresponders had lower perceived empathy scores directly after their visit (P = 0.03) and none had initially chosen phone as their preferred mode of contact for follow-up (P < 0.001). A list of all diagnoses with frequencies the surgeons stated is listed in Appendix 2.
Difference in Satisfaction with the Surgeon
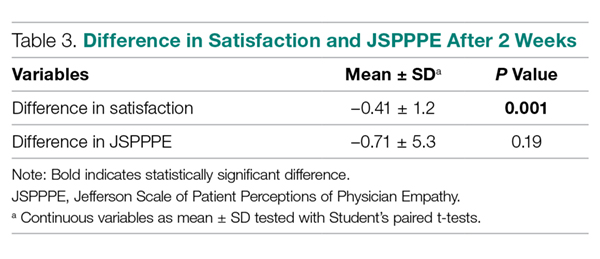
Satisfaction with the surgeon 2 weeks after the in-person visit was slightly, but significantly, lower on bivariate analysis compared to satisfaction with the surgeon immediately after the initial visit (–0.41 ± 1.2, P = 0.001; Table 3).
Difference in Perceived Physician Empathy
Perceived physician empathy 2 weeks after the in-person visit was not significantly lower on bivariate analysis compared to perceived physician empathy immediately after the initial visit (–0.71 ± 5.3, P = 0.19; Table 3).
Factors Associated with Change in Satisfaction with the Surgeon
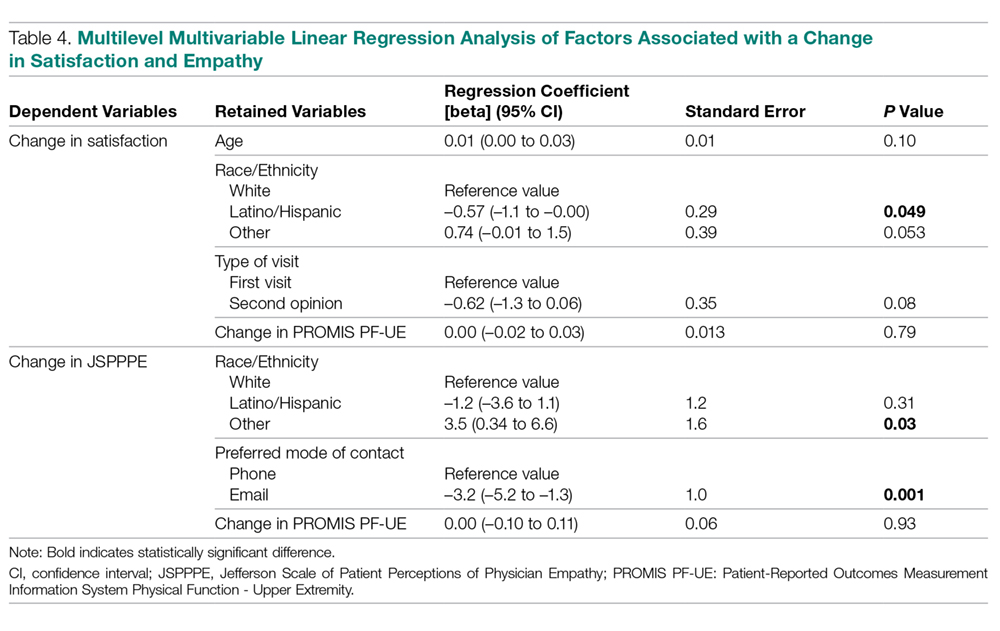
Accounting for potential interaction of variables using multilevel multivariable analysis, change in disability of the upper extremity was not associated with change in satisfaction with the surgeon (regression coefficient [beta], 0.00 [95% confidence interval {CI}, –0.02 to 0.03]; standard error [SE], 0.01; P = 0.79 [Table 4]). Being Latino was independently associated with less change in satisfaction with the surgeon (beta coefficient, –0.57 [95% CI, –1.1 to 0.00]; SE, 0.29; P = 0.049).
Factors Associated with Change in Perceived Physician Empathy
Accounting for potential interaction of variables using multilevel multivariable analysis, change in disability of the upper extremity was not associated with change in perceived physician empathy (beta coefficient = 0.00 [95% CI, –0.10 to 0.11]; SE, 0.06; P = 0.93 [Table 4]). Race/ethnicity other than white or Latino was independently associated with more change in perceived physician empathy (beta coefficient, 3.5 [95% CI, 0.34 to 6.6]; SE, 1.6; P = 0.030), and preferring email as mode of contact for follow-up was independently associated with less change in perceived physician empathy (beta coefficient, –3.2 [95% CI, –5.2 to –1.3]; SE, 1.0; P = 0.001).

