Methods
Study Design
All English-speaking new and return patients ages 18 to 89 years visiting an orthopedic surgeon in 1 of 7 clinics located in a large urban area were considered eligible for this study. Enrollment took place intermittently over a 5-month period. We were granted a waiver of written informed consent. Patients indicated their consent by completing the surveys. Patients were randomly assigned to 1 of the 4 questionnaires containing different scale types using an Excel random-number generator. After the visit, patients were asked to complete the survey. All questionnaires were administered on an encrypted tablet via a HIPAA-compliant, secure web-based application for building and managing online surveys and databases (REDCap; Research Electronic Data Capture).6 This study was approved by our Institutional Review Board and is registered on ClinicalTrials.gov (NCT03686735).7
Outcome Measures
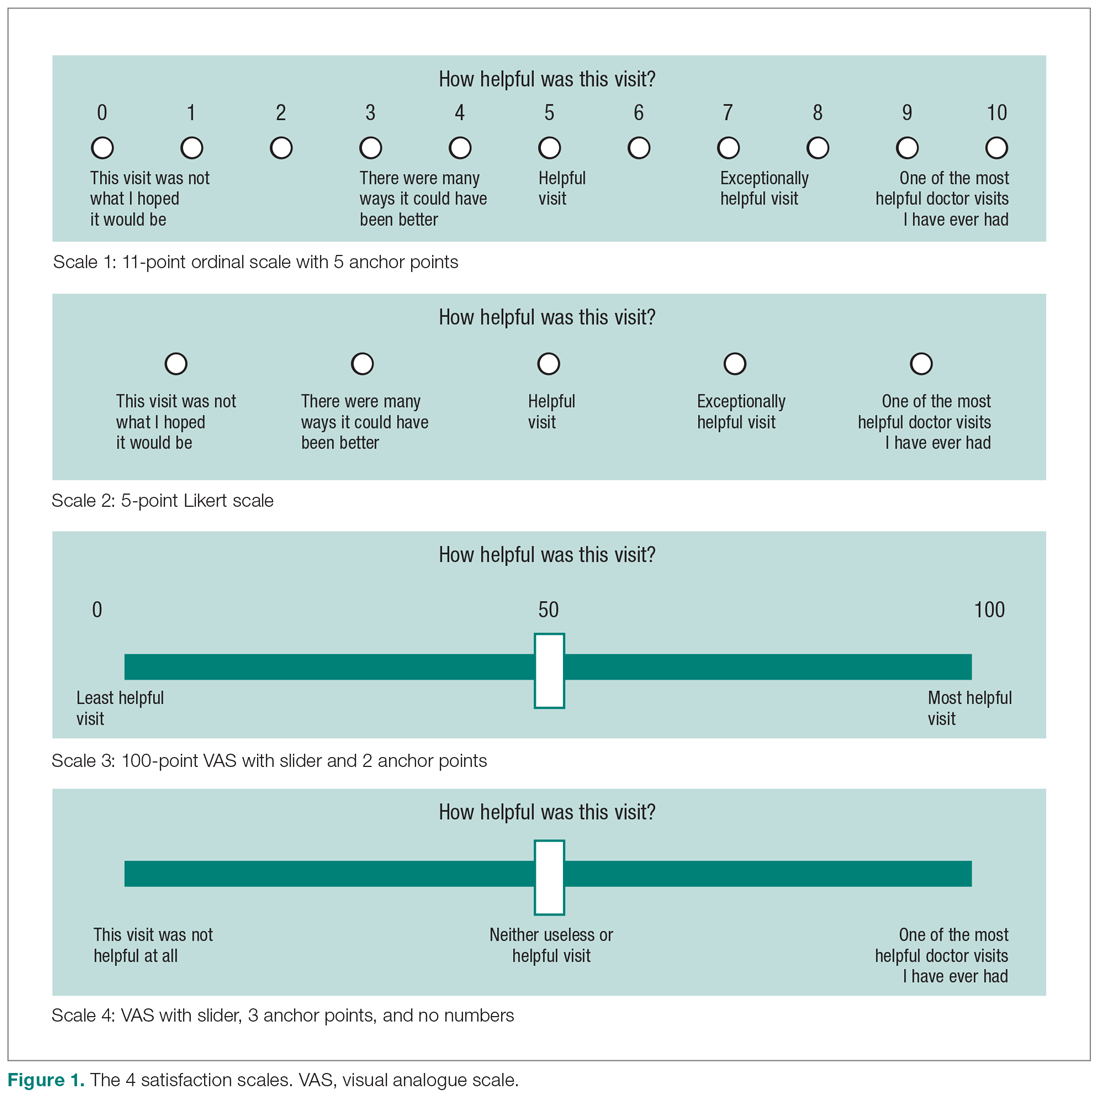
Study participants were asked to complete questionnaires regarding demographics (sex, age, race/ethnicity, marital status, level of education, work status, insurance status, comorbidities) and to rate satisfaction with their visit on the scale that was randomly assigned to them: (1) an 11-point Likert scale with 5 anchor points and visible numbers; (2) a 5-point Likert scale with 5 anchor points and no visible numbers; (3) a 0-100 VAS with 3 anchor points and visible numbers; (4) a 0-100 VAS with 3 anchor points and no visible numbers (Figure 1). The 4 scales should not differ in time needed to complete them; however, we did not explicitly measure time to completion. Participants also completed measures of psychological aspects of illness. The 2-item Pain Self-Efficacy Questionnaire (PSEQ-2) was used to measure pain self-efficacy, an effective coping strategy for pain.8 Higher PSEQ-2 scores indicate a higher level of pain self-efficacy. The 5-item Short Health Anxiety Inventory scale (SHAI-5) was also administered; higher scores on this scale indicate a greater degree of health anxiety.9 The Patient-Reported Outcomes Measurement Information System (PROMIS) Depression was used to measure symptoms of depression.10 Finally, the diagnosis was recorded by the surgeon (not in table).
Statistical Analysis
We reported continuous variables using mean, standard deviation (SD), median, and interquartile range (IQR). Categorical data are presented as frequencies and percentages. We calculated floor and ceiling effect and the skewness and kurtosis of every scale. We scaled every scale to 10 and also standardized every scale. We used the Kruskal–Wallis test to compare differences in satisfaction between the scales; Fisher’s exact test to compare differences in floor and ceiling effect; and Spearman correlation tests to test the correlation between scaled satisfaction scores and psychological status.
Ceiling effects are present when patients select the highest value on a scale rather than a value that reflects their actual feelings about a certain topic. Floor effects are present when patients select the lowest value in a similar fashion. These 2 effects indicate that an independent variable no longer influences the dependent variable being tested. Skewness and kurtosis are rough indicators of a normal distribution of values. Skewness (γ1) is an index of the symmetry of a distribution, with symmetric distributions having a skewness of 0. If skewness has a positive value, it suggests relatively many low values, having a long right tail. Negative skewness suggests relatively many high values, having a long left tail. Kurtosis (γ2) is a measure to describe tailedness of a distribution. Kurtosis of a normal distribution is 3. Negative kurtosis represents little peaked distribution, and positive kurtosis represents more peaked distribution.11,12 If skewness is 0 and kurtosis is 3, there is a normal, or Gaussian, distribution.
Finally, we manually calculated the NPS for all scales by subtracting the percentage of detractors (people who scored between 0 and 6) from the percentage of promoters (people who scored 9 or 10).13 NPS are widely used in the service industry to assess customer satisfaction, and scores range between –100 and 100.
An a priori power analysis indicated that in order to find a difference in satisfaction of 0.5 on a 0-10 scale, with an effect size of 80% and alpha set at 0.05, we needed 128 patients (64 per group). Since we wanted to compare 4 satisfaction scales, we doubled this.

