Mortality
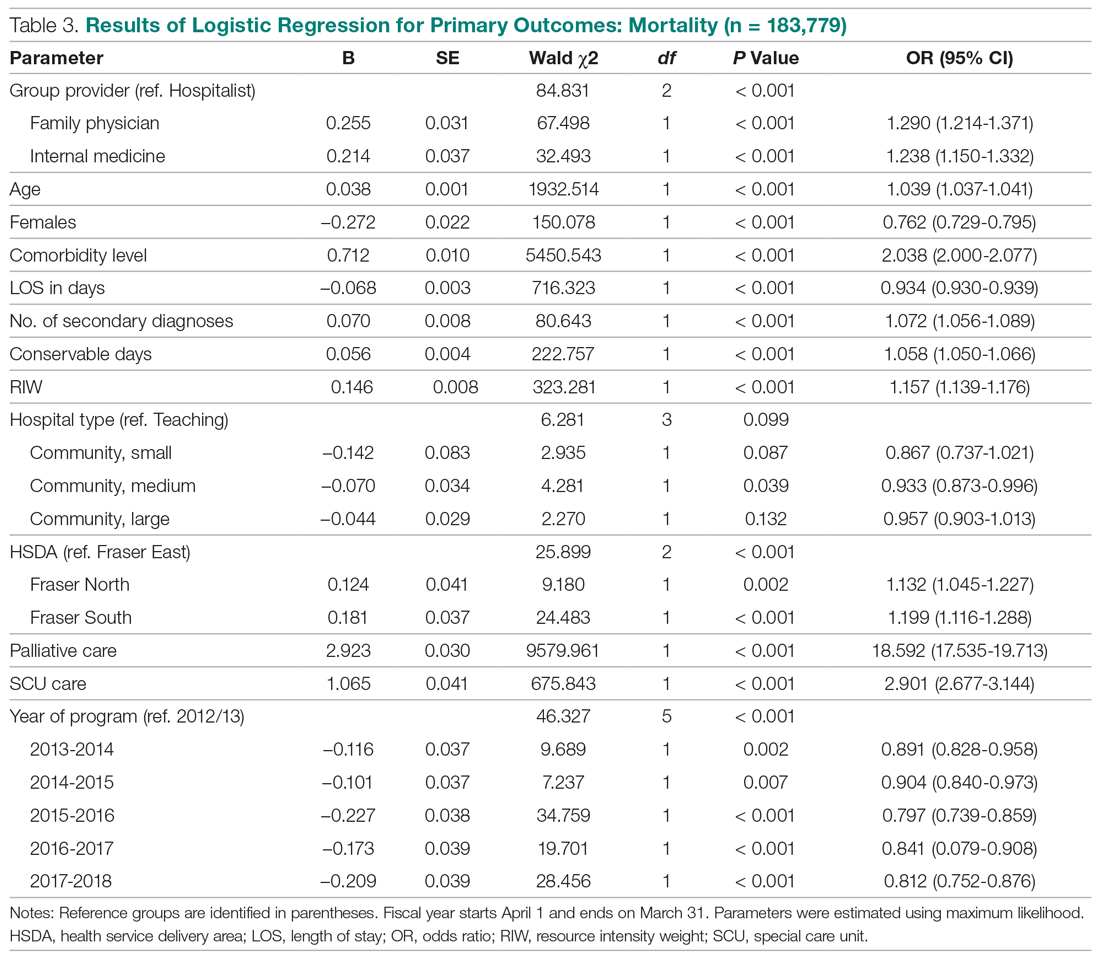
Table 3 summarizes the relationship between provider groups and in-hospital mortality (n = 183,779). Controlling for other variables, patients admitted to FP and IM providers had higher odds of mortality when compared to hospitalists (odds ratio [OR] for FPs, 1.29; 95% confidence interval [CI], 1.21-1.37; OR for IM, 1.24; 95% CI, 1.15-1.33). Older age, higher comorbidity level, higher number of secondary diagnoses, higher use of hospital resources (as measured by RIWs), longer than expected hospital stay (as measured by conservable days), and male gender were also associated with higher mortality. Similarly, patients receiving palliative care and those who spent at least 1 day in a special care unit (critical care, observation, and monitored care units) also had higher odds of mortality. On the other hand, admission to nonteaching medium facilities and longer hospital stay were associated with lower mortality. Compared to the first year of this analysis, lower mortality rates were observed in subsequent fiscal years. Finally, there appear to be geographic variations in mortality within Fraser Health.
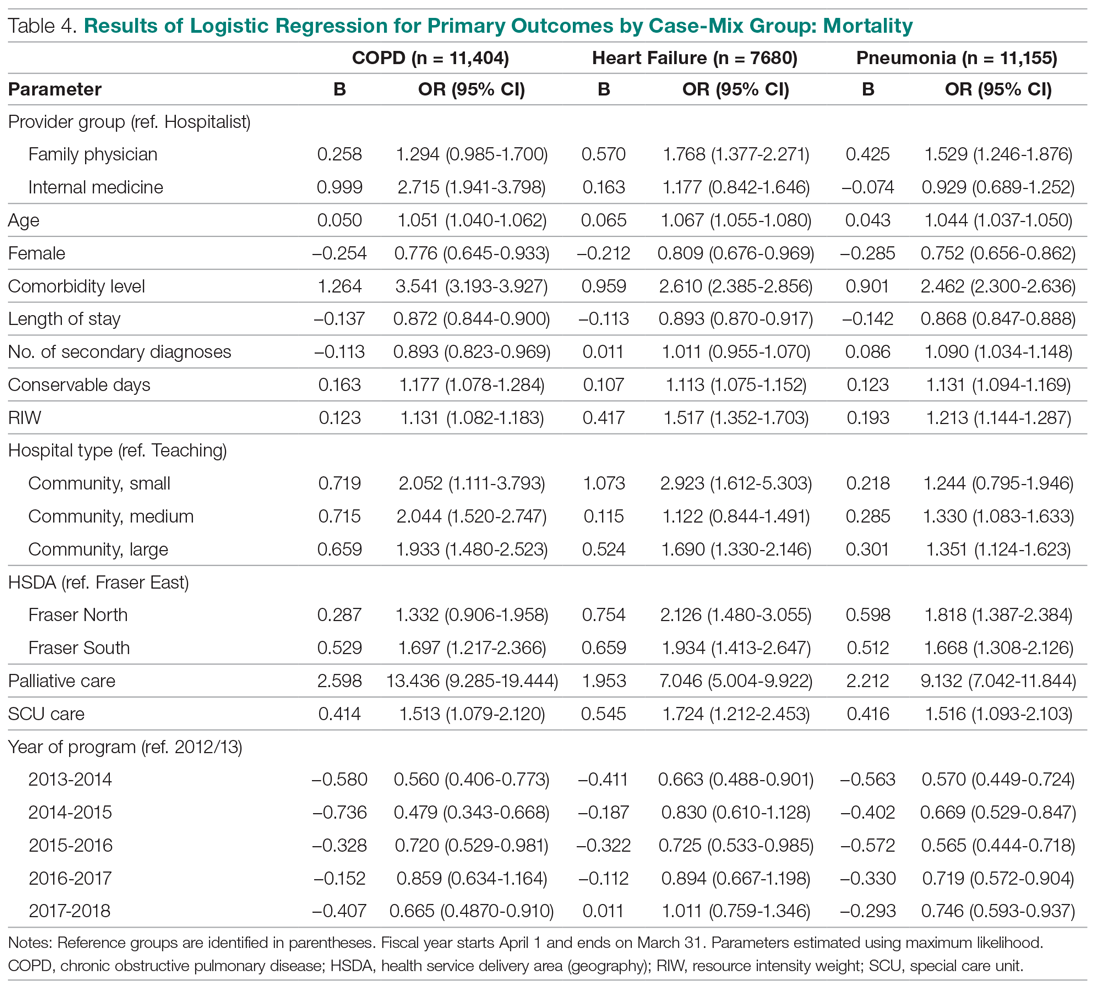
Our analysis of patients with COPD, CHF, and pneumonia showed mixed results (Table 4). Patients admitted to the FP provider group with CHF and pneumonia had higher mortality compared to hospitalists (OR for CHF, 1.77; 95% CI, 1.38-2.27; OR for pneumonia, 1.53; 95% CI, 1.25-1.88), with a similar but nonstatistically significant trend observed for patients with COPD (OR, 1.29; 95% CI, 0.99-1.70). On the other hand, the higher observed mortality associated with the IM provider group in the overall study population only persisted for patients with COPD (OR, 2.71; 95% CI, 1.94-3.80), with no statistically significant differences for patients with CHF (OR, 1.18; 95% CI, 0.84-1.65) and pneumonia (OR, 0.93; 95% CI, 0.69-1.25).
We also studied adjusted mortality as measured by HSMRs. Currently, our Health Information Management system calculates an HSMR value for each patient admitted to our acute care facilities using the methodology developed by CIHI. Prior internal audits demonstrated that our internal calculations closely approximate those reported nationally. Our analysis suggests that over time, HSMR rates for the 3 provider groups have diverged, with patients admitted to IM providers having a higher mortality rate than what would be expected based on the presenting clinical conditions and comorbidity levels (Figure, part D).
Readmission
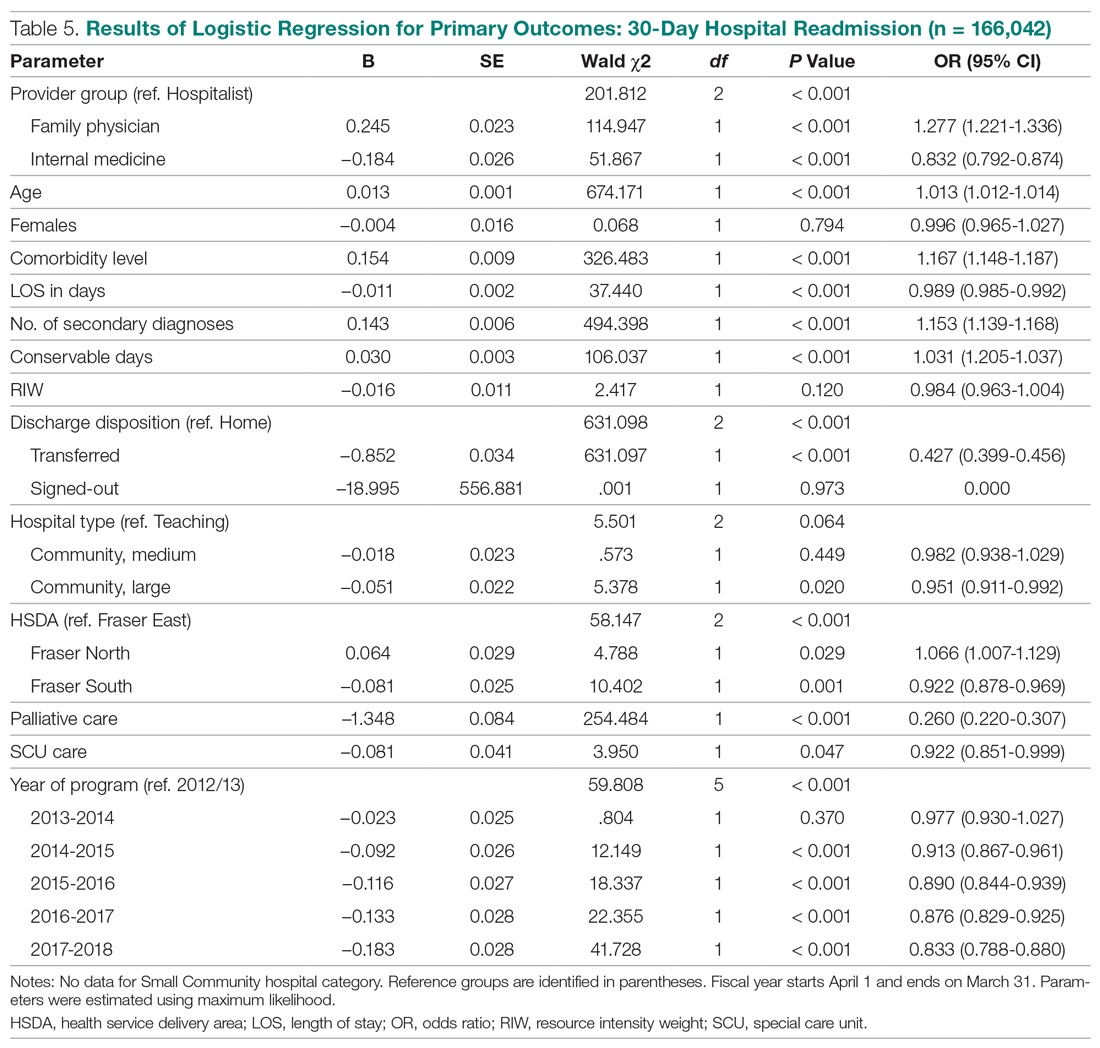
The results of our multiple logistic regression for readmission are summarized in Table 5 (n = 166,042). The impact of provider group on 30-day readmission is mixed, with higher odds associated with FPs compared to hospitalists (OR, 1.27; 95% CI, 1.22-1.34) and lower odds associated with IM physicians (OR, 0.83; 95% CI, 0.79-0.87). Gender and RIW did not show any significant associations, but increasing age, higher number of secondary diagnoses, higher comorbidity levels, and longer than expected LOS (as measure by conservable days) were associated with higher odds of readmission. Conversely, longer hospitalization, admission to a large community hospital, palliative status, admission to a special care unit, geography, and fiscal year were associated with lower odds of readmission.
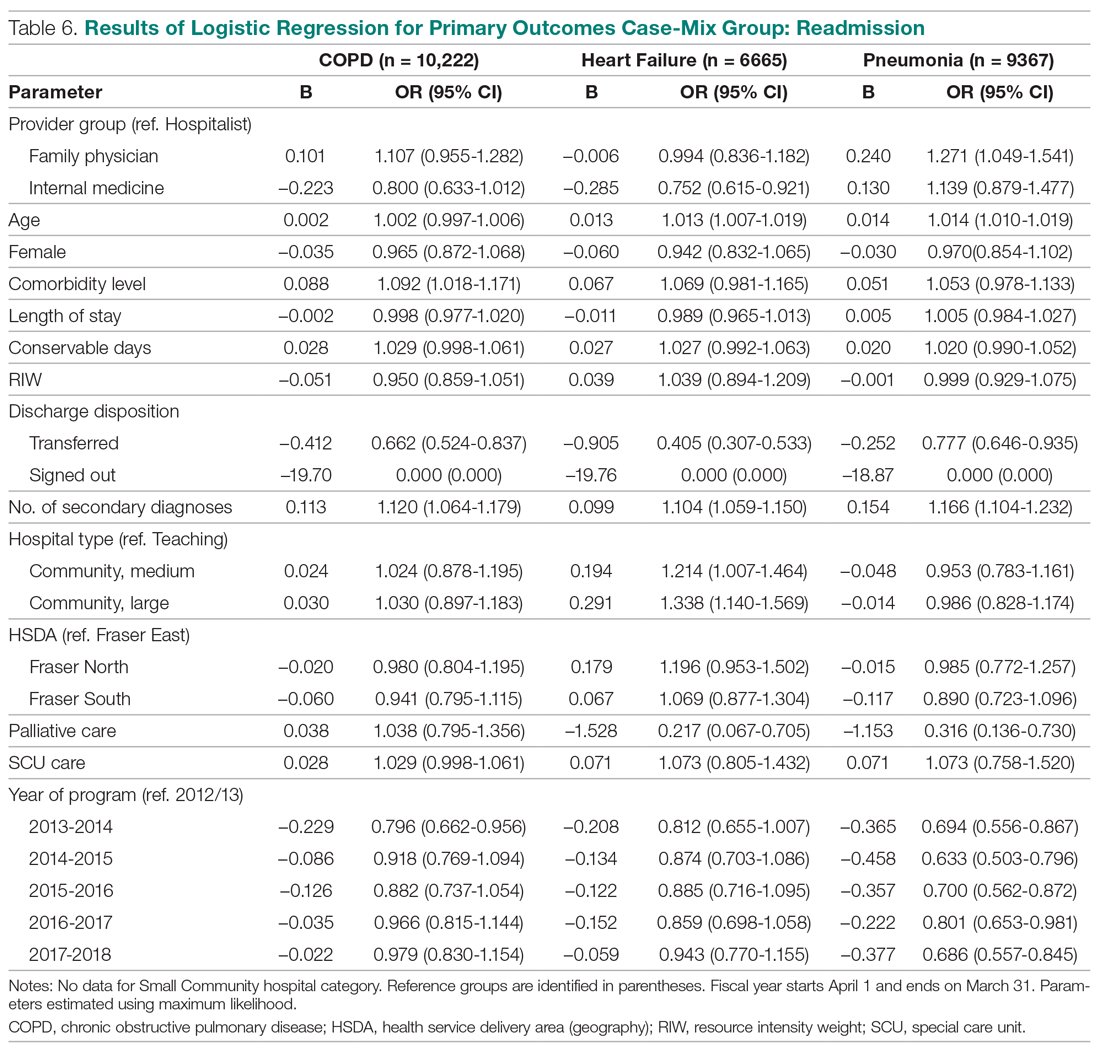
The above differences between provider groups were no longer consistently present when we analyzed patients presenting with COPD, CHF, and pneumonias (Table 6). Only patients admitted to the FP provider group with pneumonia had higher odds of readmission compared to hospitalists (OR, 1.27; 95% CI, 1.05-1.54). Conversely, only patients admitted to the IM provider group with CHF showed lower readmission (OR, 0.75; 95% CI, 0.62-0.92).


