METHODS
Exemptions were obtained from the Institutional Review Board. Data from the Nationwide Inpatient Sample (NIS) from 2006 to 2011 were extracted using the International Classification of Diseases, Ninth Revision, Clinical Modification (ICD-9-CM) codes for patients that received primary TKA or THA, as well as their comorbid conditions. No patients or populations were excluded from the sampling process. A list of all independent variables collected for analysis and provision of relevant ICD-9 codes is included in Figure 1. The NIS is the largest all-payer stratified survey of inpatient care in the US healthcare system. As of 2011, each year provides information on approximately 8 million inpatient stays from about 1000 hospitals in 46 states. All discharges from sampled hospitals are also represented in the database. All patient information is protected, and all methods were conducted in accordance with the highest ethical standards of Human and Animal Rights Research.
STATISTICAL ANALYSIS
SAS 9.2 and PROC FREQ statistics software were used to generate P values (chi square result) and analyze the trends (Cochran-Armitage). Results were weighted utilizing standard discharge weights from the NIS to ensure accurate comparison of data from different time points. P < .05 was considered statistically significant. Multivariable logistic regression analyses were performed to generate odds ratio and 95% confidence limits to assess outcomes across different demographic variables.
RESULTS
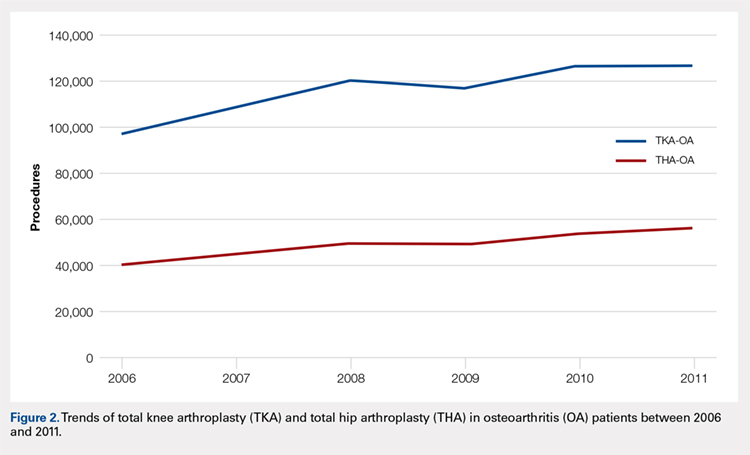
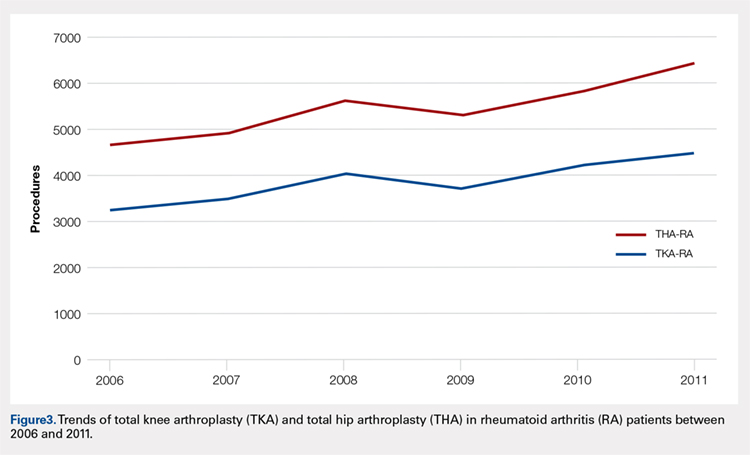
Data on 337,082 and 1,362,241 patients undergoing THA or TKA, respectively, between 2006 and 2011 were analyzed. Patients in both groups were further differentiated by a diagnosis of either OA or RA. OA was the most common diagnosis, constituting 96.8% of all arthritic THA and TKA patients. From 2006 to 2011, a 36% and 34% increase in total number of THAs and TKAs, respectively, were reported. The number of patients with OA undergoing THA and TKA steadily increased from 2006 to 2011 (Figure 2). The number of THA and TKA procedures in patients with RA followed a similar trend but at a comparatively slower rate (Figure 3). The TKA geographical trends mirrored those observed with THA. The majority of operations were performed at urban hospitals (89% THA, 87% TKA; P < .0001). Among patients with RA and OA, the majority of TKAs (47.77%; P < .0001) took place in urban non-teaching hospitals than in urban teaching hospitals (39.26%). This pattern was not the same for THA, with 44.94% being performed at urban teaching hospitals and 44.05% at urban non-teaching institutions (P < .0001). Rural hospitals accounted for a low percentage of operations for both procedures: 10.46% of THA and 12.36% of TKA (P < .0001). Large institutions (based on the number of beds) claimed the majority of cases (59% of THA and TKA).
Logistic regression analysis and odds ratios of patients with OA vs those with RA with patient outcomes adjusted for age, Charlson Comorbidity Index (CCI) score, and gender revealed that patients with OA undergoing THA had lower risk for cardiovascular (0.674; confidence interval (CI) 0.587-0.774) and pulmonary complications (0.416; CI 0.384-0.450), wound dehiscence (0.647; CI 0.561-0.747), infections (0.258; CI 0.221-0.301), and systemic complications (0.625; CI 0.562-0.695) than patients with RA. Patients with OA exhibited statistically significantly higher odds of experiencing cerebrovascular complications after THA than those with RA (1.946; CI 1.673-2.236) (Table 3). In a similar logistic regression analysis of OA vs RA in TKA, which was adjusted for age, CCI score, and gender, patients with OA had significantly higher risk for cardiovascular (1.329; CI 1.069-1.651) and cerebrovascular complications (1.635; CI 1.375-1.943) than patients with RA. Significant decreases in wound dehiscence (0.757; CI 0.639-0.896), infection (0.331; CI 0.286-0.383), and systemic complication (0.641; CI 0.565-0.729) were noted in the patients with OA and TKA (Table 4).
Table 3. Odds Ratio for In-Hospital Complications Following THA for OA Patients vs RA Patients
Odds Ratio | Confidence Limits | |
Cardiovascular complication | .674 | .587-.744 |
Cerebrovascular complication | 1.946 | 1.673-2.236 |
Pulmonary complication | .416 | .384-.450 |
Wound dehiscence | .647 | .561-.747 |
Infection | .258 | .221-.301 |
Systemic complication | .625 | .562-.695 |
Abbreviations: OA, osteoarthritis; RA, rheumatoid arthritis; THA, total hip arthroplasty.
Table 4. Odds Ratio for In-Hospital Complications Following TKA for OA Patients vs RA Patients
Odds Ratio | Confidence Limits | |
Cardiovascular complication | 1.329 | 1.069-1.651 |
Cerebrovascular complication | 1.635 | 1.375-1.943 |
Pulmonary complication | 1.03 | .995-1.223 |
Wound dehiscence | .757 | .639-.896 |
Infection | .331 | .286-.383 |
Systemic complication | .641 | .565-.729 |
Abbreviations: OA, osteoarthritis; RA, rheumatoid arthritis; TKA, total knee arthroplasty.
Continue to: Discussion...