RESULTS
Specimen donors were 46% (6/13) male with an average age of 78.5 years (±13.77; range, 56-91 years) and 54% (7/13) female with an average age of 76.57 years (±14.37; range, 59-102 years). Average BMD was significantly lower in female (0.71 ± 0.18) than in male specimens (1.15 ± 0.33) (P < .05).
The average load to full extension across all specimens was 272 N (±54; range, 160-360 N) and was well balanced across matched pairs (270 ± 56 N for BF and 273 ± 54 N for SF). Of the 13 BF specimens, 4 experienced distraction across the fracture line during the determination of the minimum load to full extension. This initial pretest gap was measured with digital calipers (average, 1.5 mm; range, 0.90-1.85 mm) and added as an offset to the respective DVRT displacement data recorded during testing.
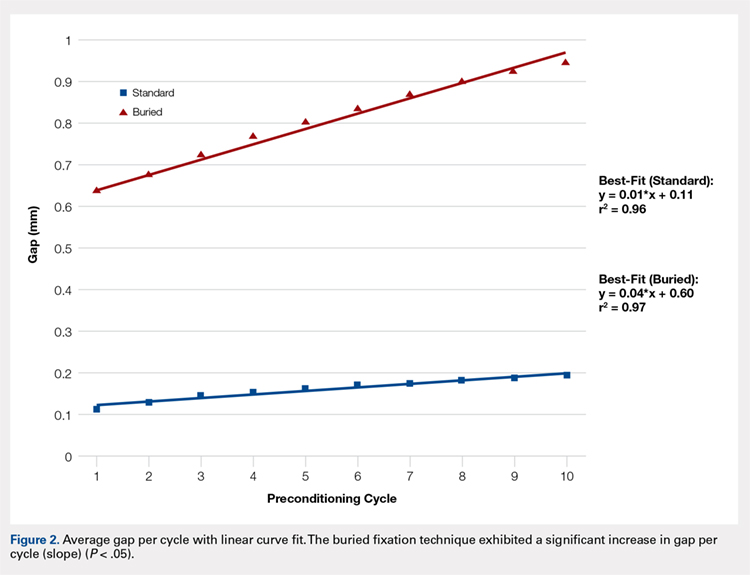
The total number of specimens included in the displacement data calculations decreased from 13 to 11 per group because DVRT data were not recorded during cyclic loading for 1 specimen and were considered unreliable in another. The maximum displacement measured across the fracture site during cyclic loading was significantly higher in the BF (0.94 ± 1.21) group than in the SF group (0.19 ± 0.26) as shown in the Table. The average slope of the gap per cycle for each specimen was calculated and compared between the BF and SF groups. The BF group demonstrated a significantly greater increase in gap per cycle than the SF group (Figure 2). Stiffness during load to failure was calculated for all but 1 specimen that did not display any measurable displacement during the final loading cycle. The average final stiffness and failure load between the BF and SF groups were not significantly different (Table). An equal number of specimens in both groups failed through gapping (6/13) and pullout (7/13).
Table. Means and Standard Deviations of the Main Outcome Measures
Standard Fixation | Buried Fixation | N | P-value | |
Load at Failure (N) | 1112.78 ± 457.25 | 973.20 ± 321.38 | 13 | 0.265 |
Final Stiffness (N/mm) | 358.42 ± 165.45 | 445.33 ± 310.09 | 11 | 0.175 |
Max Cyclic Gap (mm) | 0.19 ± 0.26 | 0.94 ± 1.21 | 11 | 0.026a |
Pullout: Gap Failure (ratio) | 7:6 | 7:6 | 13 | NS |
aIndicates statistical significance (P < .05).
Abbreviation: NS, not significant.
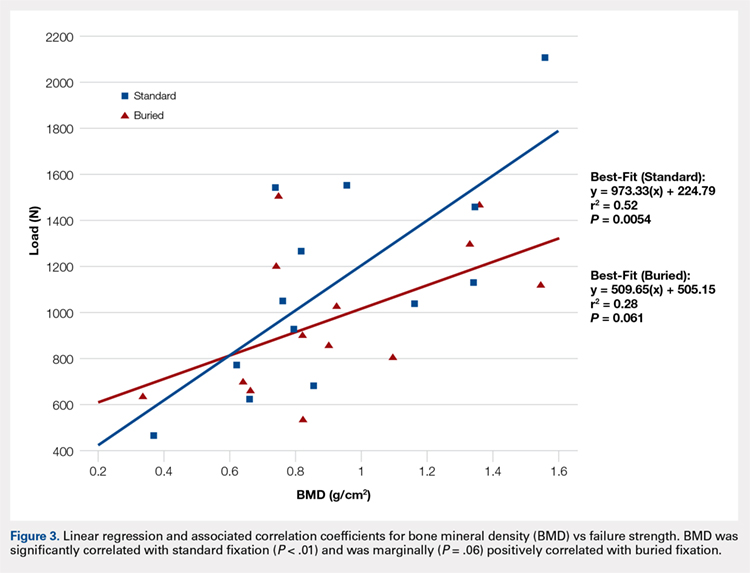
Failure load was significantly positively correlated with BMD (R = 0.62, P < .001) when all specimens were grouped together. When analyzed separately, the SF group was significantly correlated with BMD (P < .01), whereas the BF group had a marginally significant correlation (P = .06) with BMD (Figure 3). In both groups, BMD was positively correlated with stiffness and negatively correlated with gapping. Neither of these trends, however, was significant.
Continue to: Discussion...


