Dermal fillers are considered Class III medical devices by the US Food and Drug Administration (FDA).1 Reports of adverse events (AEs) for medical devices are made public by the FDA to allow for transparent postmarketing surveillance.2The AE trends extracted from these historical data may help distinguish between expected learning curves of new dermal fillers versus unsafe products that may require FDA intervention. Considering that aesthetic treatments are not medically necessary, a low risk profile is paramount and determining what constitutes normal learning curves is important for impartial assessment of AEs as new fillers come on the market. The concept of a 3-year learning curve can be an important tool for safety monitoring going forward, creating a bar for quality that could trigger increased surveillance if a product fails to meet an expected arc of diminished AEs over time. This study serves to evaluate historical AE data and to establish learning curves for FDA-approved dermal fillers.
Methods
We searched the OpenFDA Device Adverse Event Report Browser (http://openfda.shinyapps.io/devicereports/) for reported AEs within the FDA product code LMH (Implant, Dermal, For Aesthetic Use) that were received from January 1, 1983, to December 31, 2017. For each reported AE, information related to the date of the reported event and the device brand name were recorded. Devices implicated in each AE were classified based on primary composition according to the following 5 categories: collagen, hyaluronic acid (HA), hydroxylapatite, poly-L-lactic acid (PLLA), and polymethyl methacrylate (PMMA). Inaccurate entries of reported AEs or those intended for nonaesthetic use were excluded from the study. A total of 8530 AEs were included in the study. To normalize the data, we obtained annual reports for the number of procedures performed by filler type from the American Society of Plastic Surgeons (ASPS) cosmetic procedure trends. 3 We calculated the annual AE rates for each approved filler by dividing the number of AEs by the number of procedures performed that year.
Results
The trends of different filler types depicting the number of procedures performed over time are shown in Figure 1. Data from the ASPS dated back to 2005; therefore, the number of procedures performed prior to that were extrapolated with knowledge of products’ approval dates and market share, indicated by a dotted line. To determine AE rates for each year, we divided the number of AEs by the number of reported procedures for each filler type. The AE rates are displayed graphically in Figures 2 and 3 with superimposed FDA approval dates for each filler.4

Figure 1. Trends in the number of individual dermal filler procedures performed annually. Because data were not available prior to 2005, the number of procedures was extrapolated (dotted lines) based on known approved filler market share at that time. PMMA indicates polymethylmethacrylate; PLLA, poly-L-lactic acid; HA, hyaluronic acid.
Two major peaks in reported AE rates for all fillers were noted in the late 1990s and late 2000s, mostly associated with collagen and PLLA fillers, respectively (Figure 2). Overall, there has been a low rate of AEs associated with HA fillers since their initial approval in the early 2000s.

Figure 2. Rate of adverse events (AEs) reported for dermal fillers by year. The rates were calculated as the number of AEs divided by the number of procedures performed of that filler type per year. Each stacked bar chart includes contributions from each filler type. PMMA indicates polymethylmethacrylate; PLLA, poly-L-lactic acid; HA, hyaluronic acid.
Individual filler AE rates also were analyzed. Hyaluronic acid fillers were associated with an extremely low rate of AEs, ranging from 1 to 4 AEs per 10,000 procedures (Figure 3A). This low AE rate profile underscores the safety of HA fillers, which has spurred their popularity. Adverseevent rates for collagen fillers spiked in the mid- to late 1990s and resolved over the course of the next 3 years (Figure 3B). Hydroxylapatite fillers had a rather uniform AE rate with an early indication of a drop-off after 2015 (Figure 3C). Poly-L-lactic acid fillers showed the steepest learning curve, with a peak of 1 AE per 100 procedures after they were approved in 2008 (Figure 3D); however, there is a comparable 3-year resolution of AE rates. Adverse events for PMMA fillers did not show specific resolution, meaning that they did not follow the 3-year arc that was seen for the other dermal fillers reported in the data set (Figure 3E).
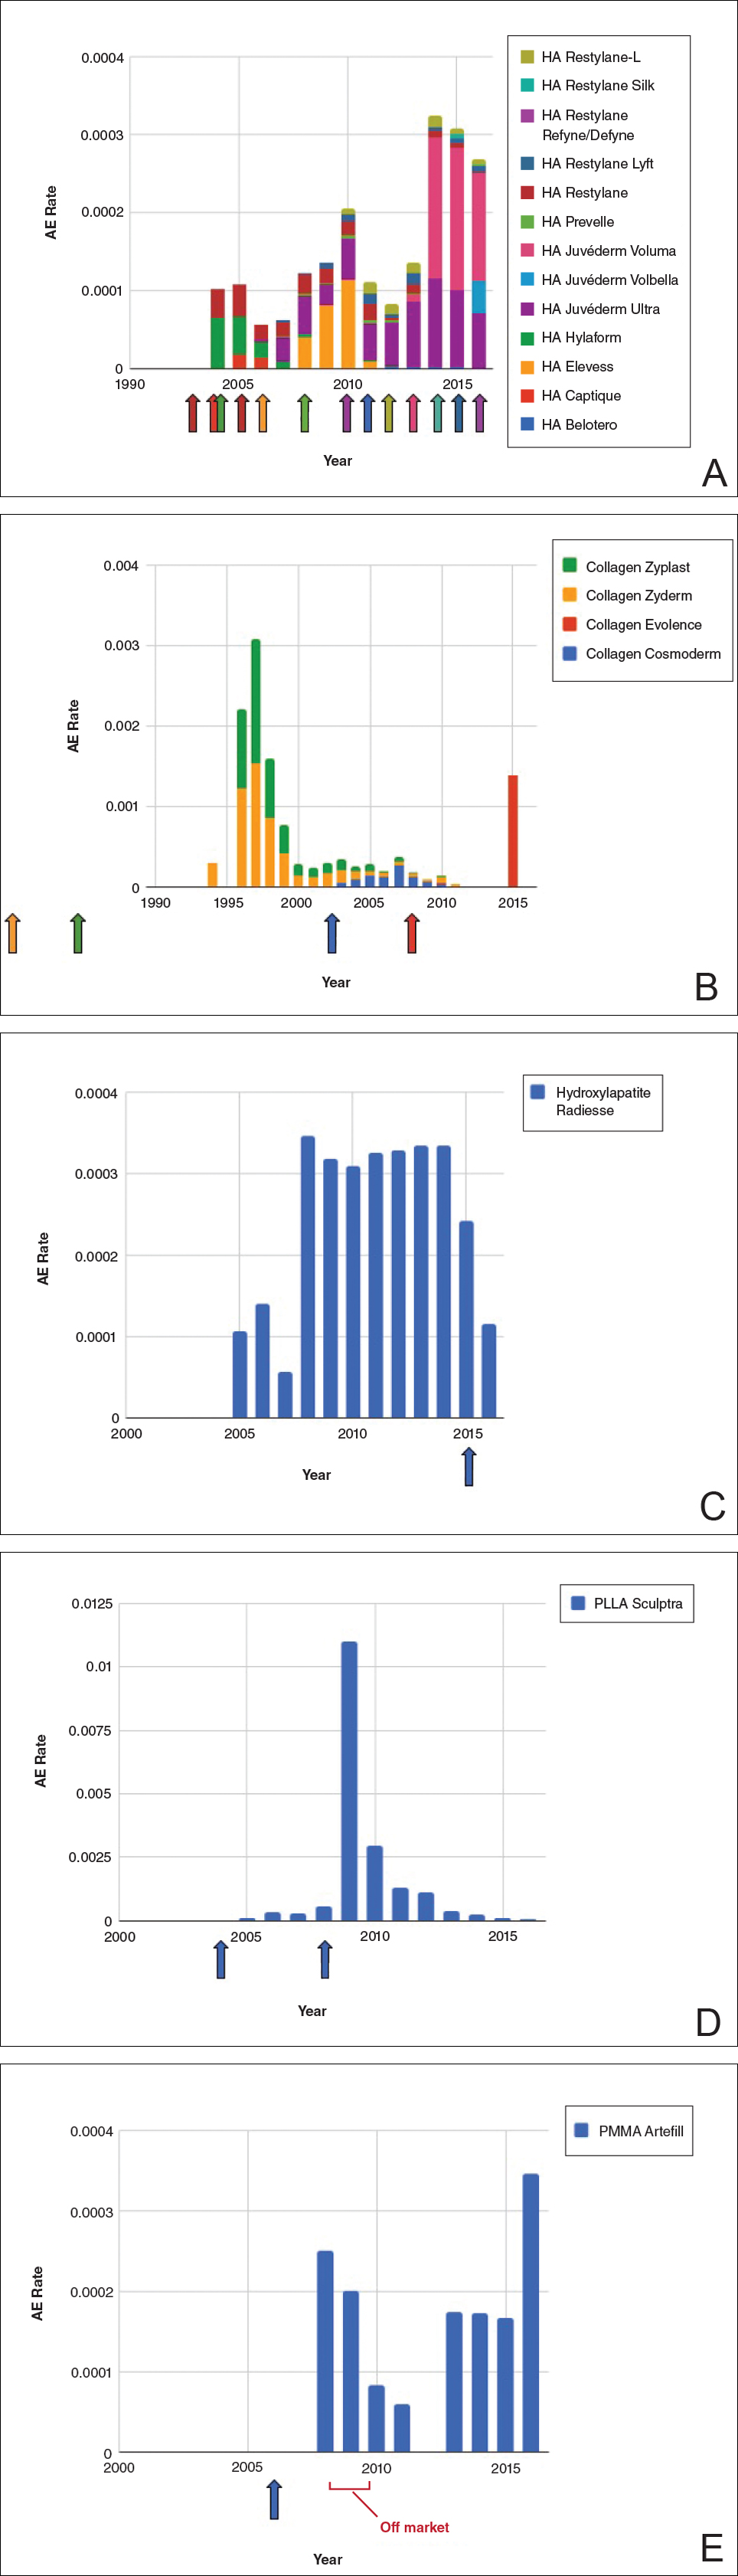
Figure 3. Rate of adverse events (AEs) associated with hyaluronic acid (HA)(A), collagen (B), hydroxylapatite (C), poly-L-lactic acid (PLLA)(D), and polymethylmethacrylate (PMMA)(E) fillers by year. The rates were calculated as the number of AEs divided by the known number of procedures performed for that filler type per year. Individual approval dates are denoted by the colored arrows corresponding with each product. Each stacked bar chart includes contributions from each filler type.