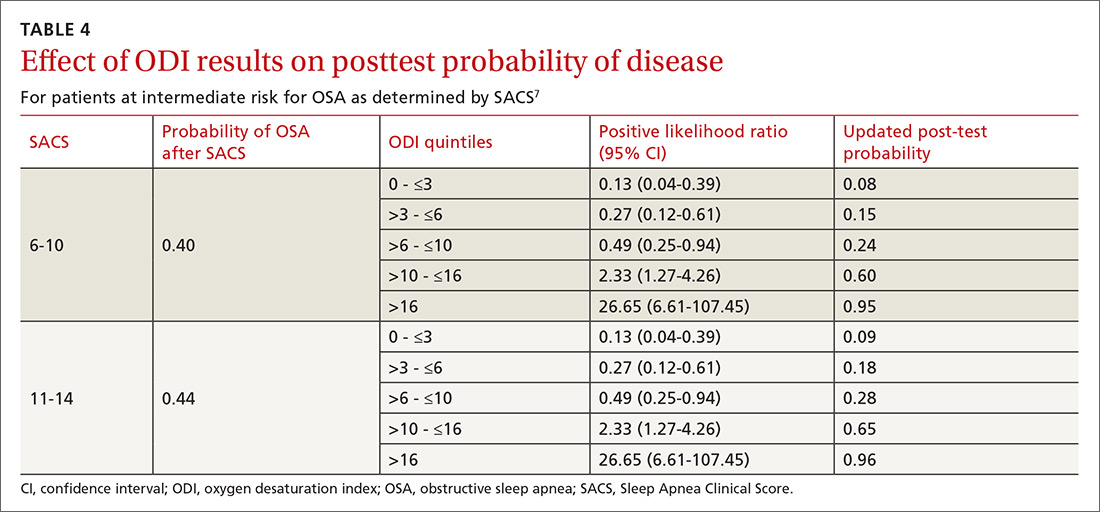
As ODI was found to be the strongest predictor of OSA, we grouped these results in quintiles and calculated positive LRs. TABLE 4 shows their effect on PTP of disease among patients with intermediate risk. An ODI result >10 effected an upward recalibration of disease probability (LR, 2.33; 95% CI, 1.27-4.26). The optimal cutoff of ODI to discriminate between those with and without OSA was determined by ROC analysis. An ODI greater than 8.4 created a PTP of disease of approximately 73% to 77%.
Our internal clinical guidelines recommend referring patients with an ODI of 5 or greater for sleep medicine consultation. We examined the ability of this ODI result to recalibrate disease suspicion for a patient at low risk (SACS ≤5). The LR for ODI of 5 or greater is 2.1, but this only results in a recalibration of risk from 24% pretest probability in our validation cohort to 41% PTP (95% CI, 33-49). This low cutoff for a positive test creates false-positive results more than 40% of the time due to low specificity (0.58). This is insufficient to change the suspicion of disease, resulting only in a shift to intermediate OSA risk.
DISCUSSION
Among 3 different oximetry measurements, an ODI ≥10 best predicts OSA, both independently and when used sequentially after the SACS. ODI was by far the most frequent abnormality on oximetry in our cohort, thereby increasing its utility in clinical decision making. For those subjects at intermediate risk, a cutoff of 10 for the ODI result may be a simple and clinically effective way to recalibrate risk and aid in making referral decisions. (This may also be simpler and more easily remembered by clinicians than the 8.4 ODI results from the ROC analyses.)
Assessment is inadequate without a clinical prediction rule. Unfortunately, providers cannot simply rely on clinical gestalt in diagnosing OSA. In their derivation cohort, Flemens et al examined the LRs created by SACS and by clinician prediction based on history and physical exam.7 The SACS LRs ranged from 5.17 to 0.25, a 20-fold range. This reflected superior diagnostic information compared with subjective physician impression, where LRs ranged from 3.7 to 0.52, a seven-fold range. Myers et al prepared a meta-analysis of 4 different trials that examined physicians’ ability to predict OSA.9 Despite the researchers’ use of experienced sleep medicine doctors, the overall diagnostic accuracy of clinical impression was modest (summary positive LR, 1.7; 95% CI, 1.5-2; I2 = 0%; summary negative LR, 0.67; 95% CI, 0.60-0.74; I2 = 10%; sensitivity, 58%; specificity, 67%). This is similar to reliance on a single clinical sign or symptom to predict OSA.
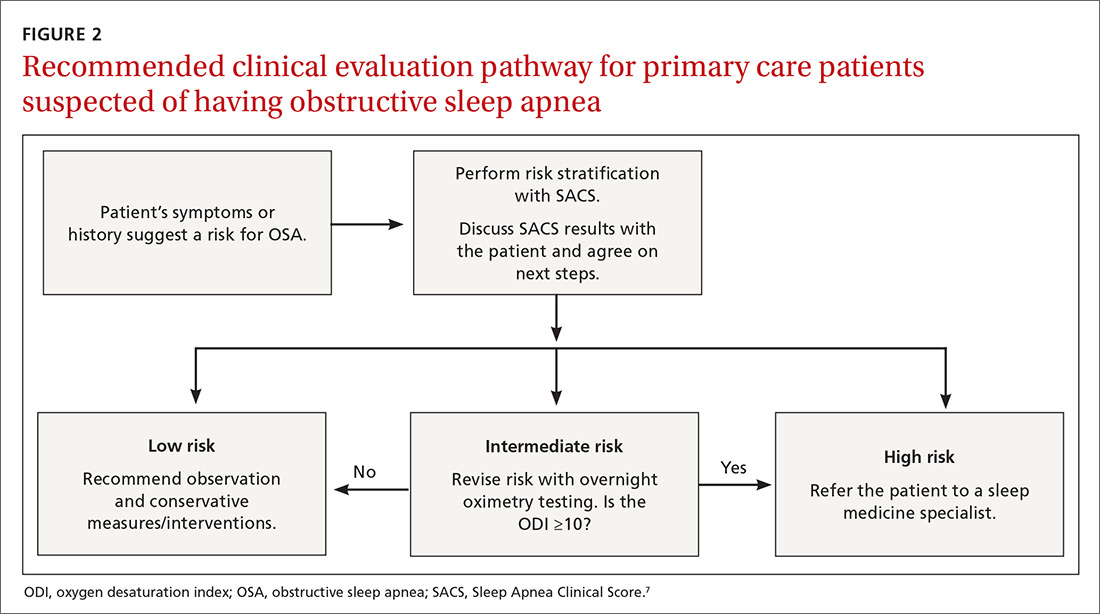
Wise use of oximetry augments SACS calculation. To limit unnecessary oximetry testing in low- and high-risk groups and to avoid polysomnography in cases of a low PTP of disease, we advocate limiting oximetry testing to individuals in the SACS intermediate-risk group (FIGURE 2) wherein ODI results can potentially recalibrate risk assessment up or down. (Those in the high- risk group should be referred to a sleep medicine specialist.) Our institutional recommendation of using an ODI result of ≥5 as a threshold to increase suspicion of disease requires a caveat for the low-risk group. “Positive” results at that low diagnostic threshold are frequently false.
Continue to: Multiple benefits of SACS


