We entered additional information reported directly by patients and obtained from their sleep studies into a REDCap database and transferred that to our statistical program. We used descriptive statistics to determine ranges and central tendencies of oximetry results. Receiver operator characteristic (ROC) analyses described the predictive abilities for each oximetry result individually and in serial application with prior SACS determinations. For comparison, we used the area under the ROC curve (AUC) from logistic regression to model the probability of OSA.
We calculated positive likelihood ratios (LR) and 95% confidence intervals (CI) to determine the degree of oximetry abnormality that would recalibrate risk either to a high PTP of OSA (>75%) or a low PTP (<25%). We sorted intermediate-risk SACS scores into quintiles based on ODI results to compare the resulting PTPs of OSA. We applied the PTP of OSA from our previous work (using the SACS score to compute the LR) as the new PTP, estimated the LR based on ODI, and computed an updated PTP of OSA. We also used ROC analysis to determine the optimal cutoff value of the ODI.
Finally, in accordance with our internal clinical practice recommendations, we examined the predictive ability of a “positive” ODI result of ≥5 to recalibrate risk prediction for OSA for patients in the low-risk group. We performed analyses using SAS 9.4 (SAS Institute, Cary, NC).
RESULTS
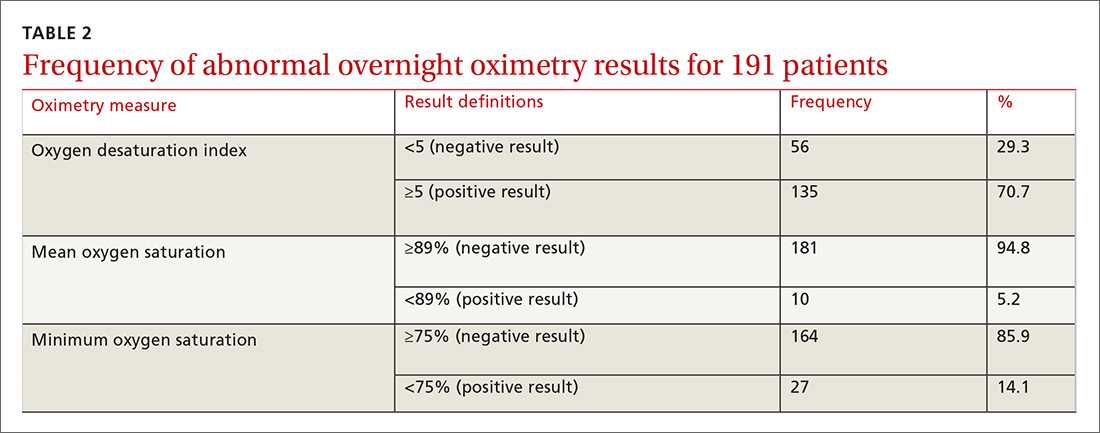
One hundred ninety-one subjects completed assessments. The median and quartile results for ODI, mean saturation, and minimum saturation are found in TABLE 1. TABLE 2 shows the distribution of patients with positive oximetry results. An ODI of 5 or greater was the most frequent abnormal result (135/191; 70.7%).
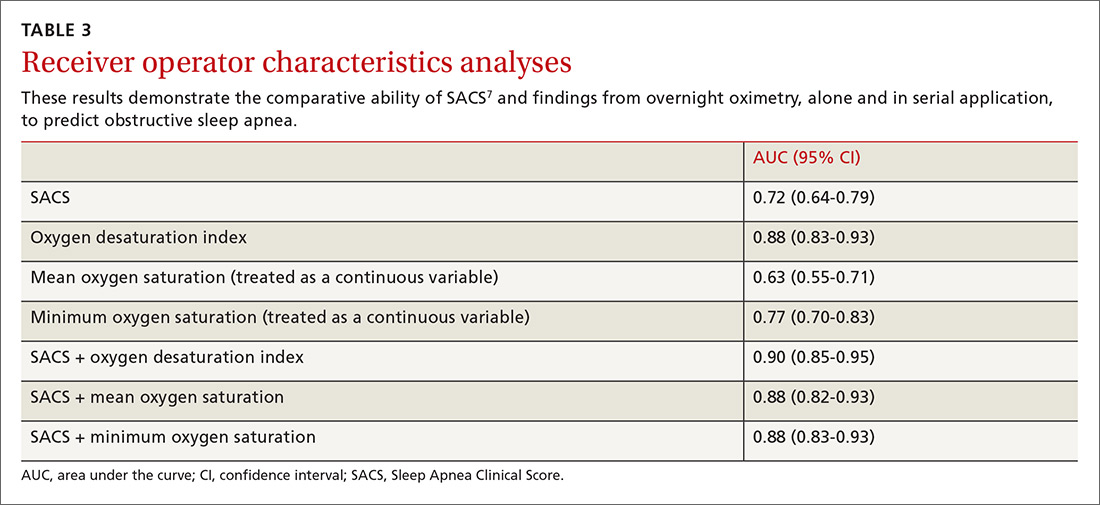
We used the AUC to measure the comparative abilities of SACS and the 3 overnight oximetry results in predicting OSA (TABLE 3). ODI results demonstrated the best ability to predict OSA, compared with polysomnography as the relative gold standard (AUC, 0.88; 95% confidence interval [CI], 0.83-0.93). Serial application of SACS and ODI yielded even better diagnostic results (AUC, 0.90; 95% CI, 0.85-0.95).
Continue to: As ODI was found to be the strongest predictor of OSA...


